At the end of 2021, we expressed hopes that 2022 would see a return to normalcy. We shouldn’t have done that, because we jinxed it. 2022 ended up being even more volatile than the previous year, as we move from a pandemic into a new European war, and make a rapid transition into a higher-interest economy.
Due to runaway inflation in the United States, the Fed has hiked interest rates at an unprecedented pace. This has had a knock-on effect on private bank loans in Singapore: The 3M SORA rate in 1Q 2023 is expected to reach 3.3 to 3.5 per cent, significantly higher than the two per cent average we’ve known over the past decade.
We need to bear this in mind as we examine the property market numbers for 2022, as the higher rates could result in unpredictable shifts. We don’t yet know, for instance, if a high-interest rate is sufficient to deter property investors and drive prices down; not when there is an equally strong desire for safe-haven assets, due to the Russia-Ukraine war.
For now, we’d avoid making any assumptions that the patterns we see here will continue into 2023; things are at a tipping point at the moment.
*The following is accurate as of 31st December 2022, but note that some numbers may show slight deviations when final tabulations are reported in January 2023.
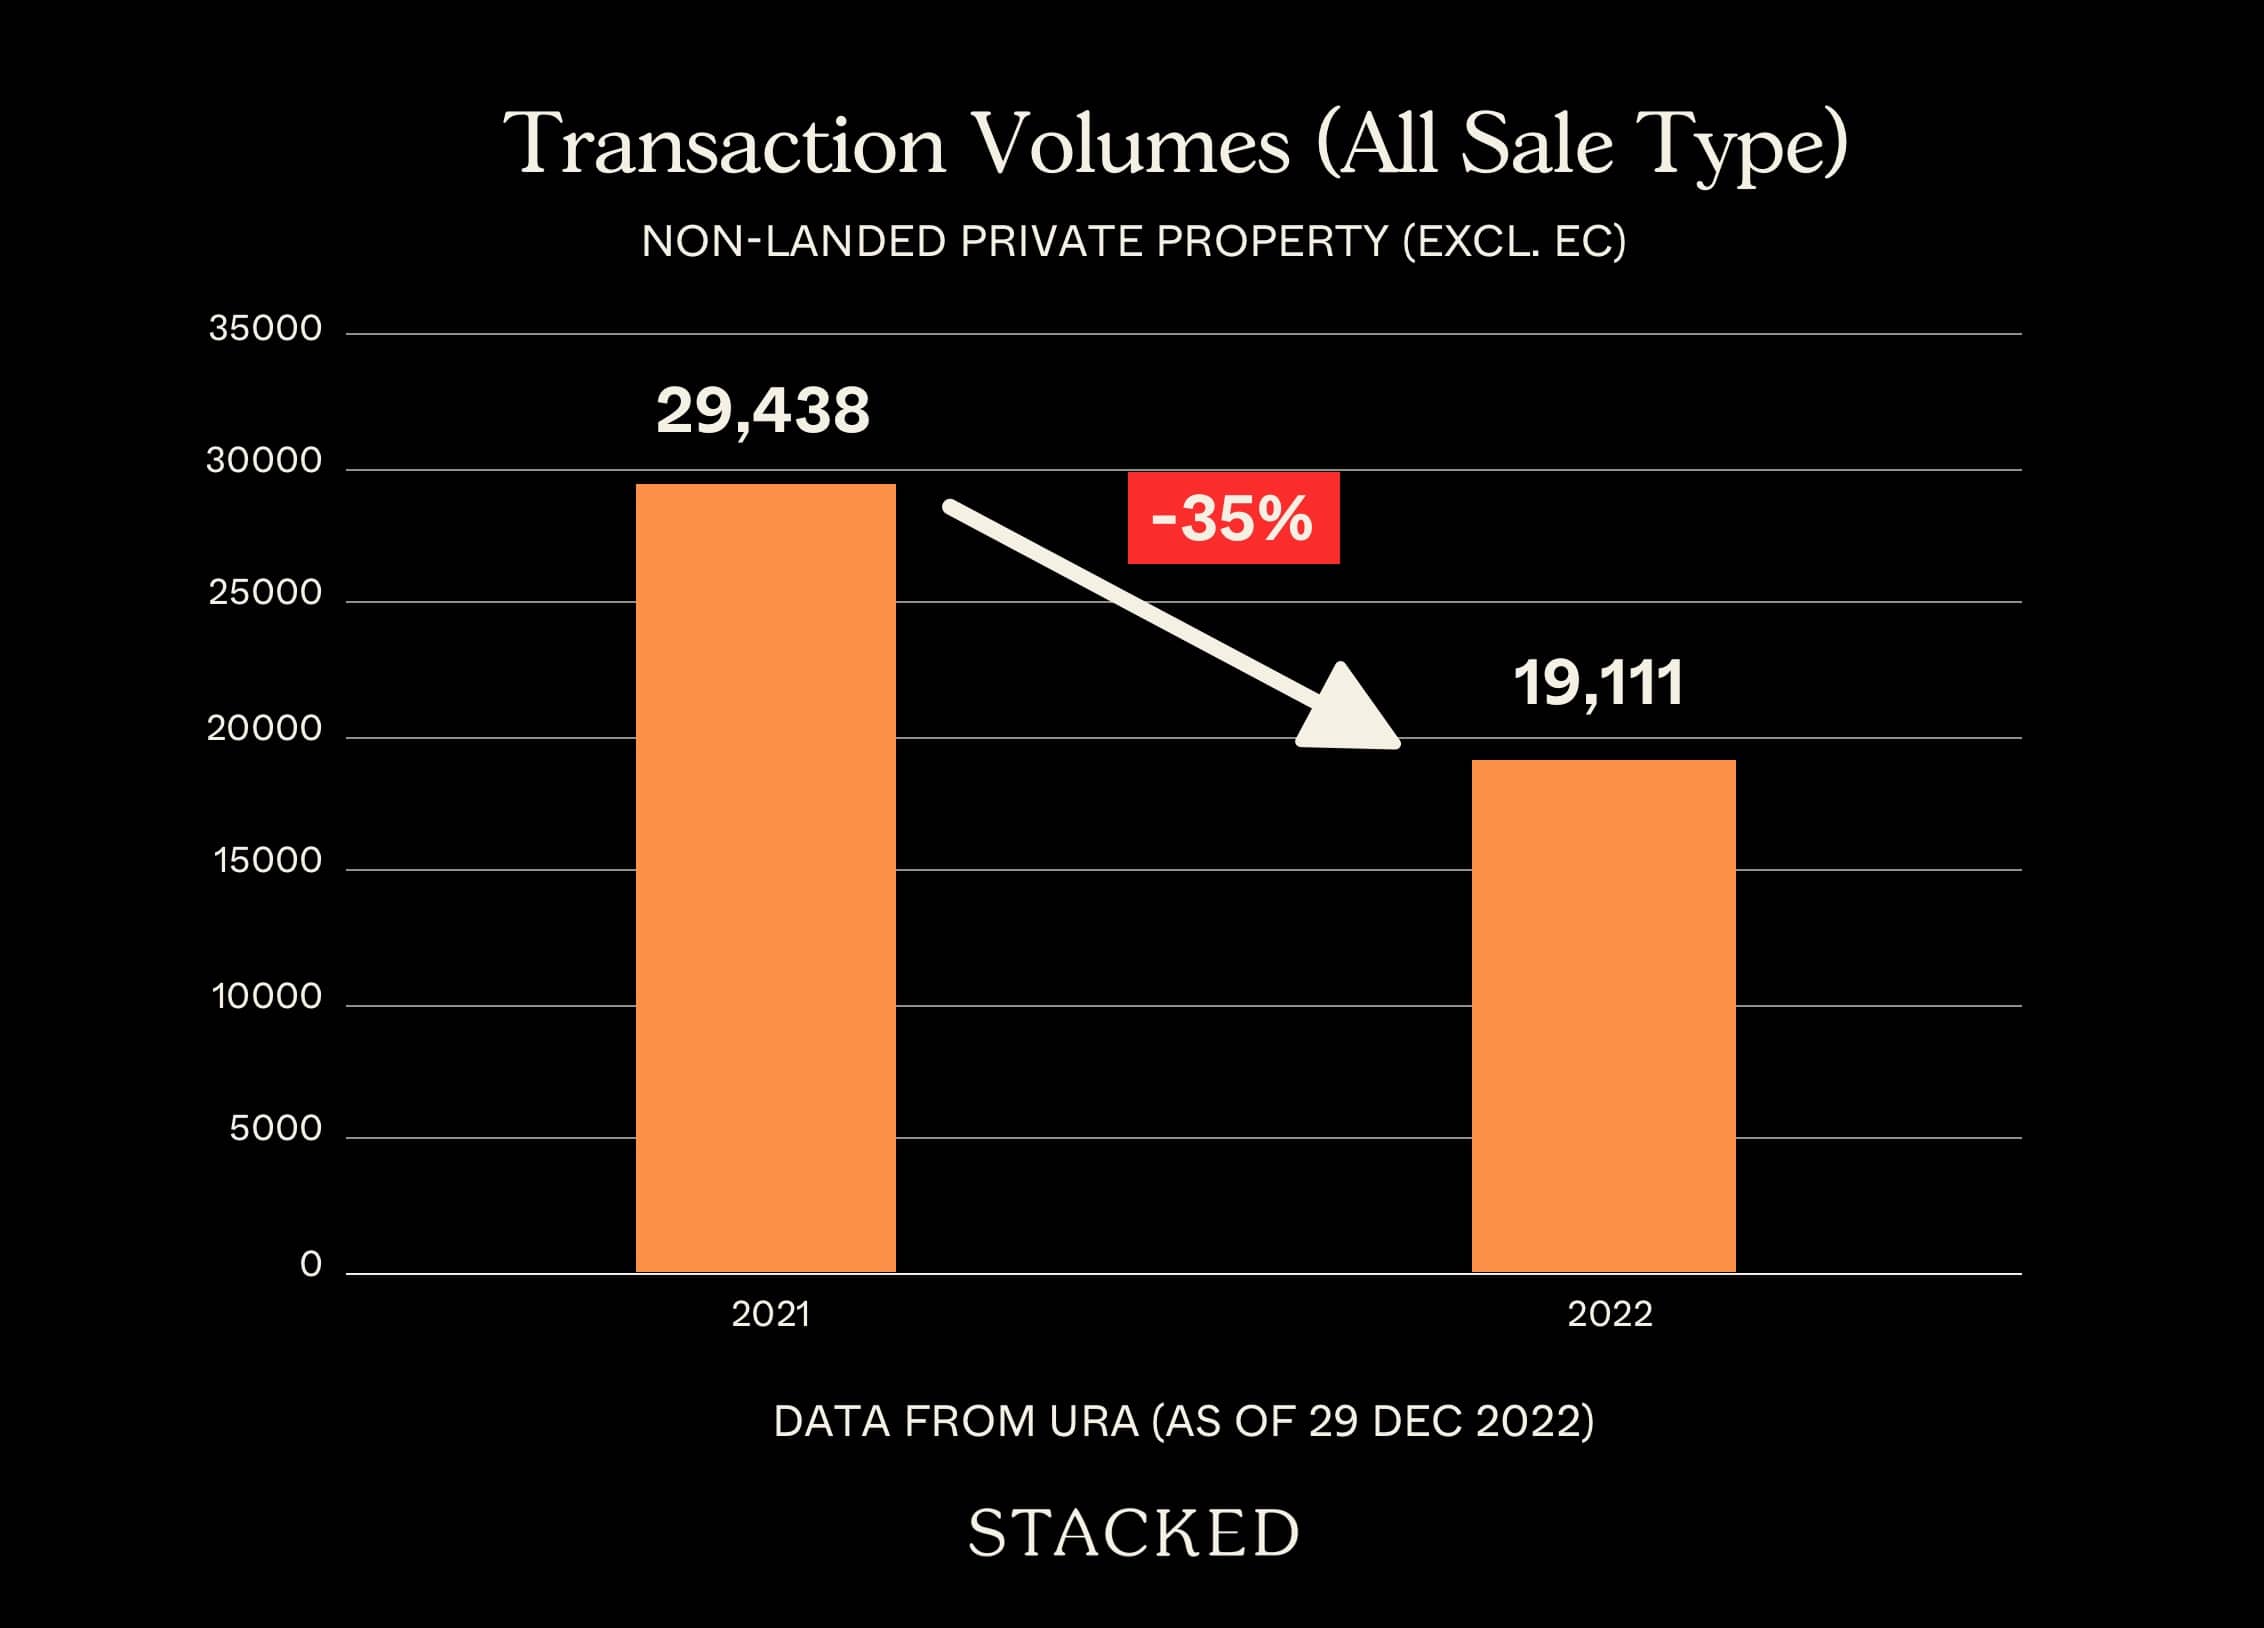
Transaction volumes
New sale transactions were down significantly from 2021, with just 6,783 recorded transactions. This is around a 46 per cent drop from the 12,535 transactions in 2021.
This was expected though; it was already reported in end-2021 that we would see fewer new launches. Another factor is that the 1,000+ unit mega-developments of Treasure at Tampines, Normanton Park, etc. has sold off the last of their inventory. In 2022, there were no new launches of equally significant size.
Resale transactions are also dipping, falling to 11,678 units. This is around a 29 per cent decrease from 16,380 units the previous year. This is likely due to a pair of recent cooling measures (along with rising interest rates), which came quite close to each other – in December 2021 and September 2022.
Reductions in Total Debt Servicing Ratio (TDSR) limits, along with a higher interest rate floor, may have put some buyers in a wait-and-see mood.
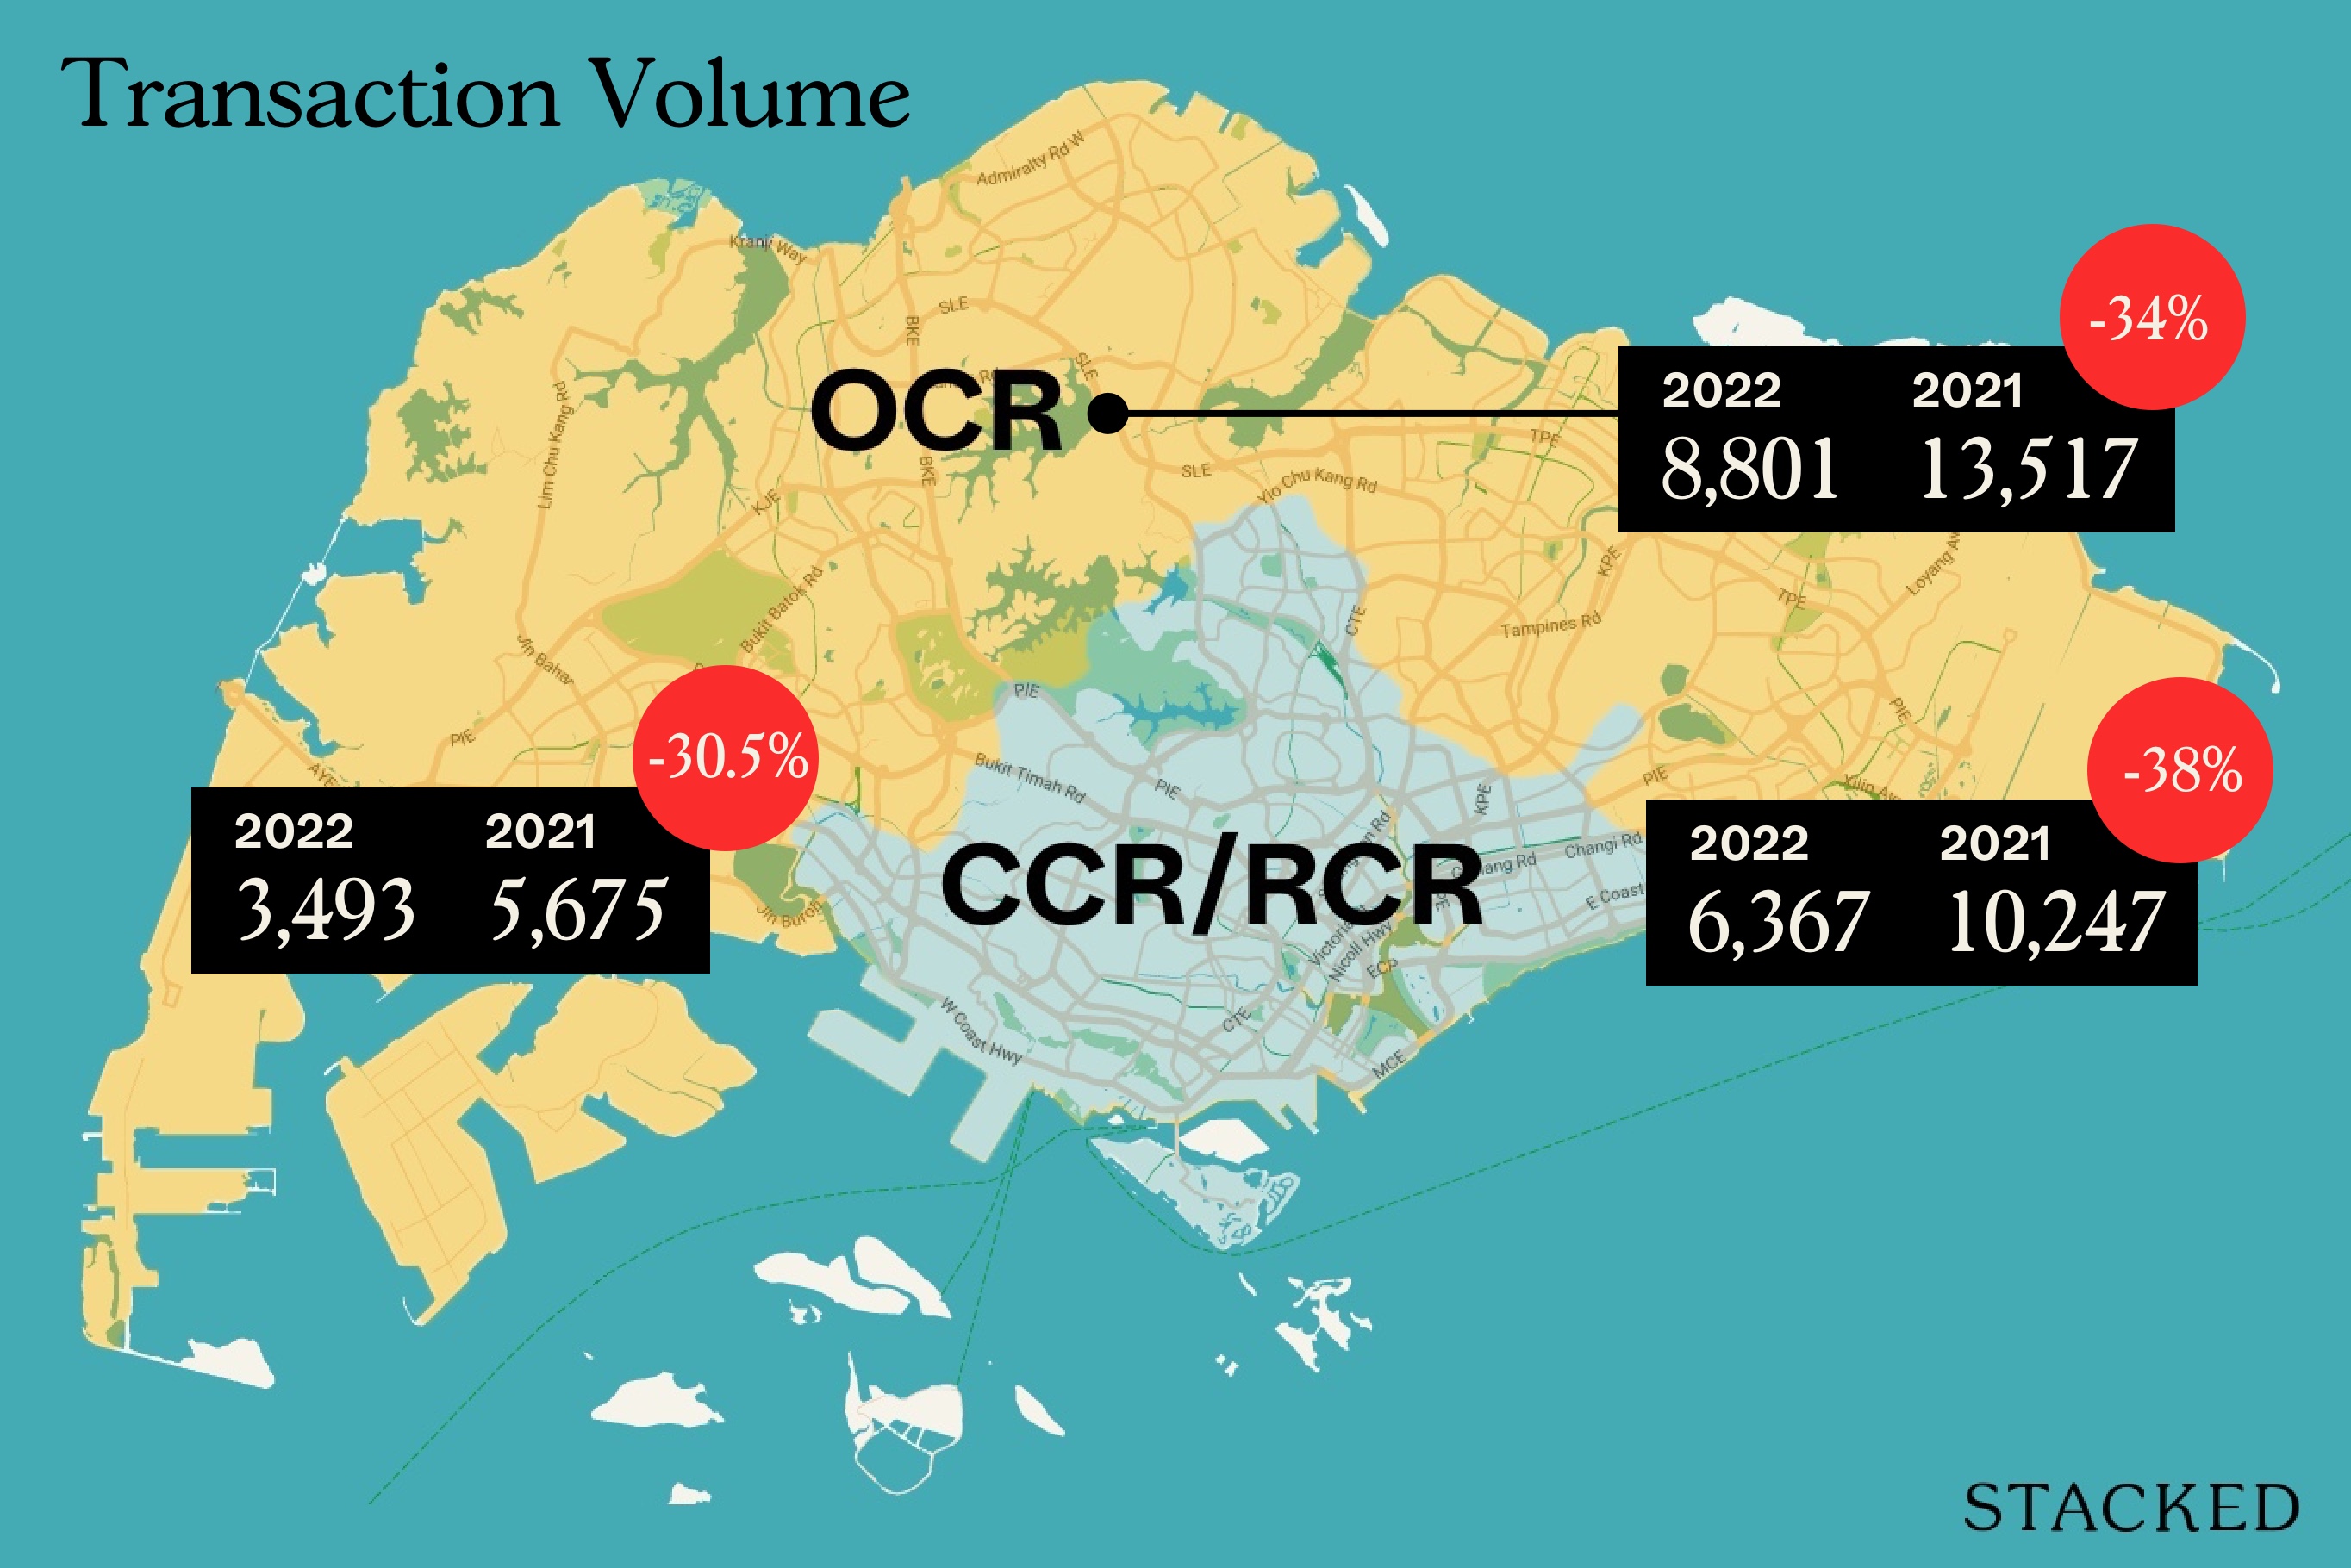
Regional breakdown
The CCR had the best showing in terms of transaction volume. 3,493 transactions were recorded, down around 30.5 per cent from 5,675 units the previous year.

The OCR had the next best showing, with transactions at 8,801 units. This was down around 34 per cent from 13,517 units the previous year.
The RCR saw the steepest drop in transaction volume, with just 6,367 transactions. This was down almost 38 per cent from 10,247 units the previous year.
Price movement for non-landed private homes (excluding ECs)
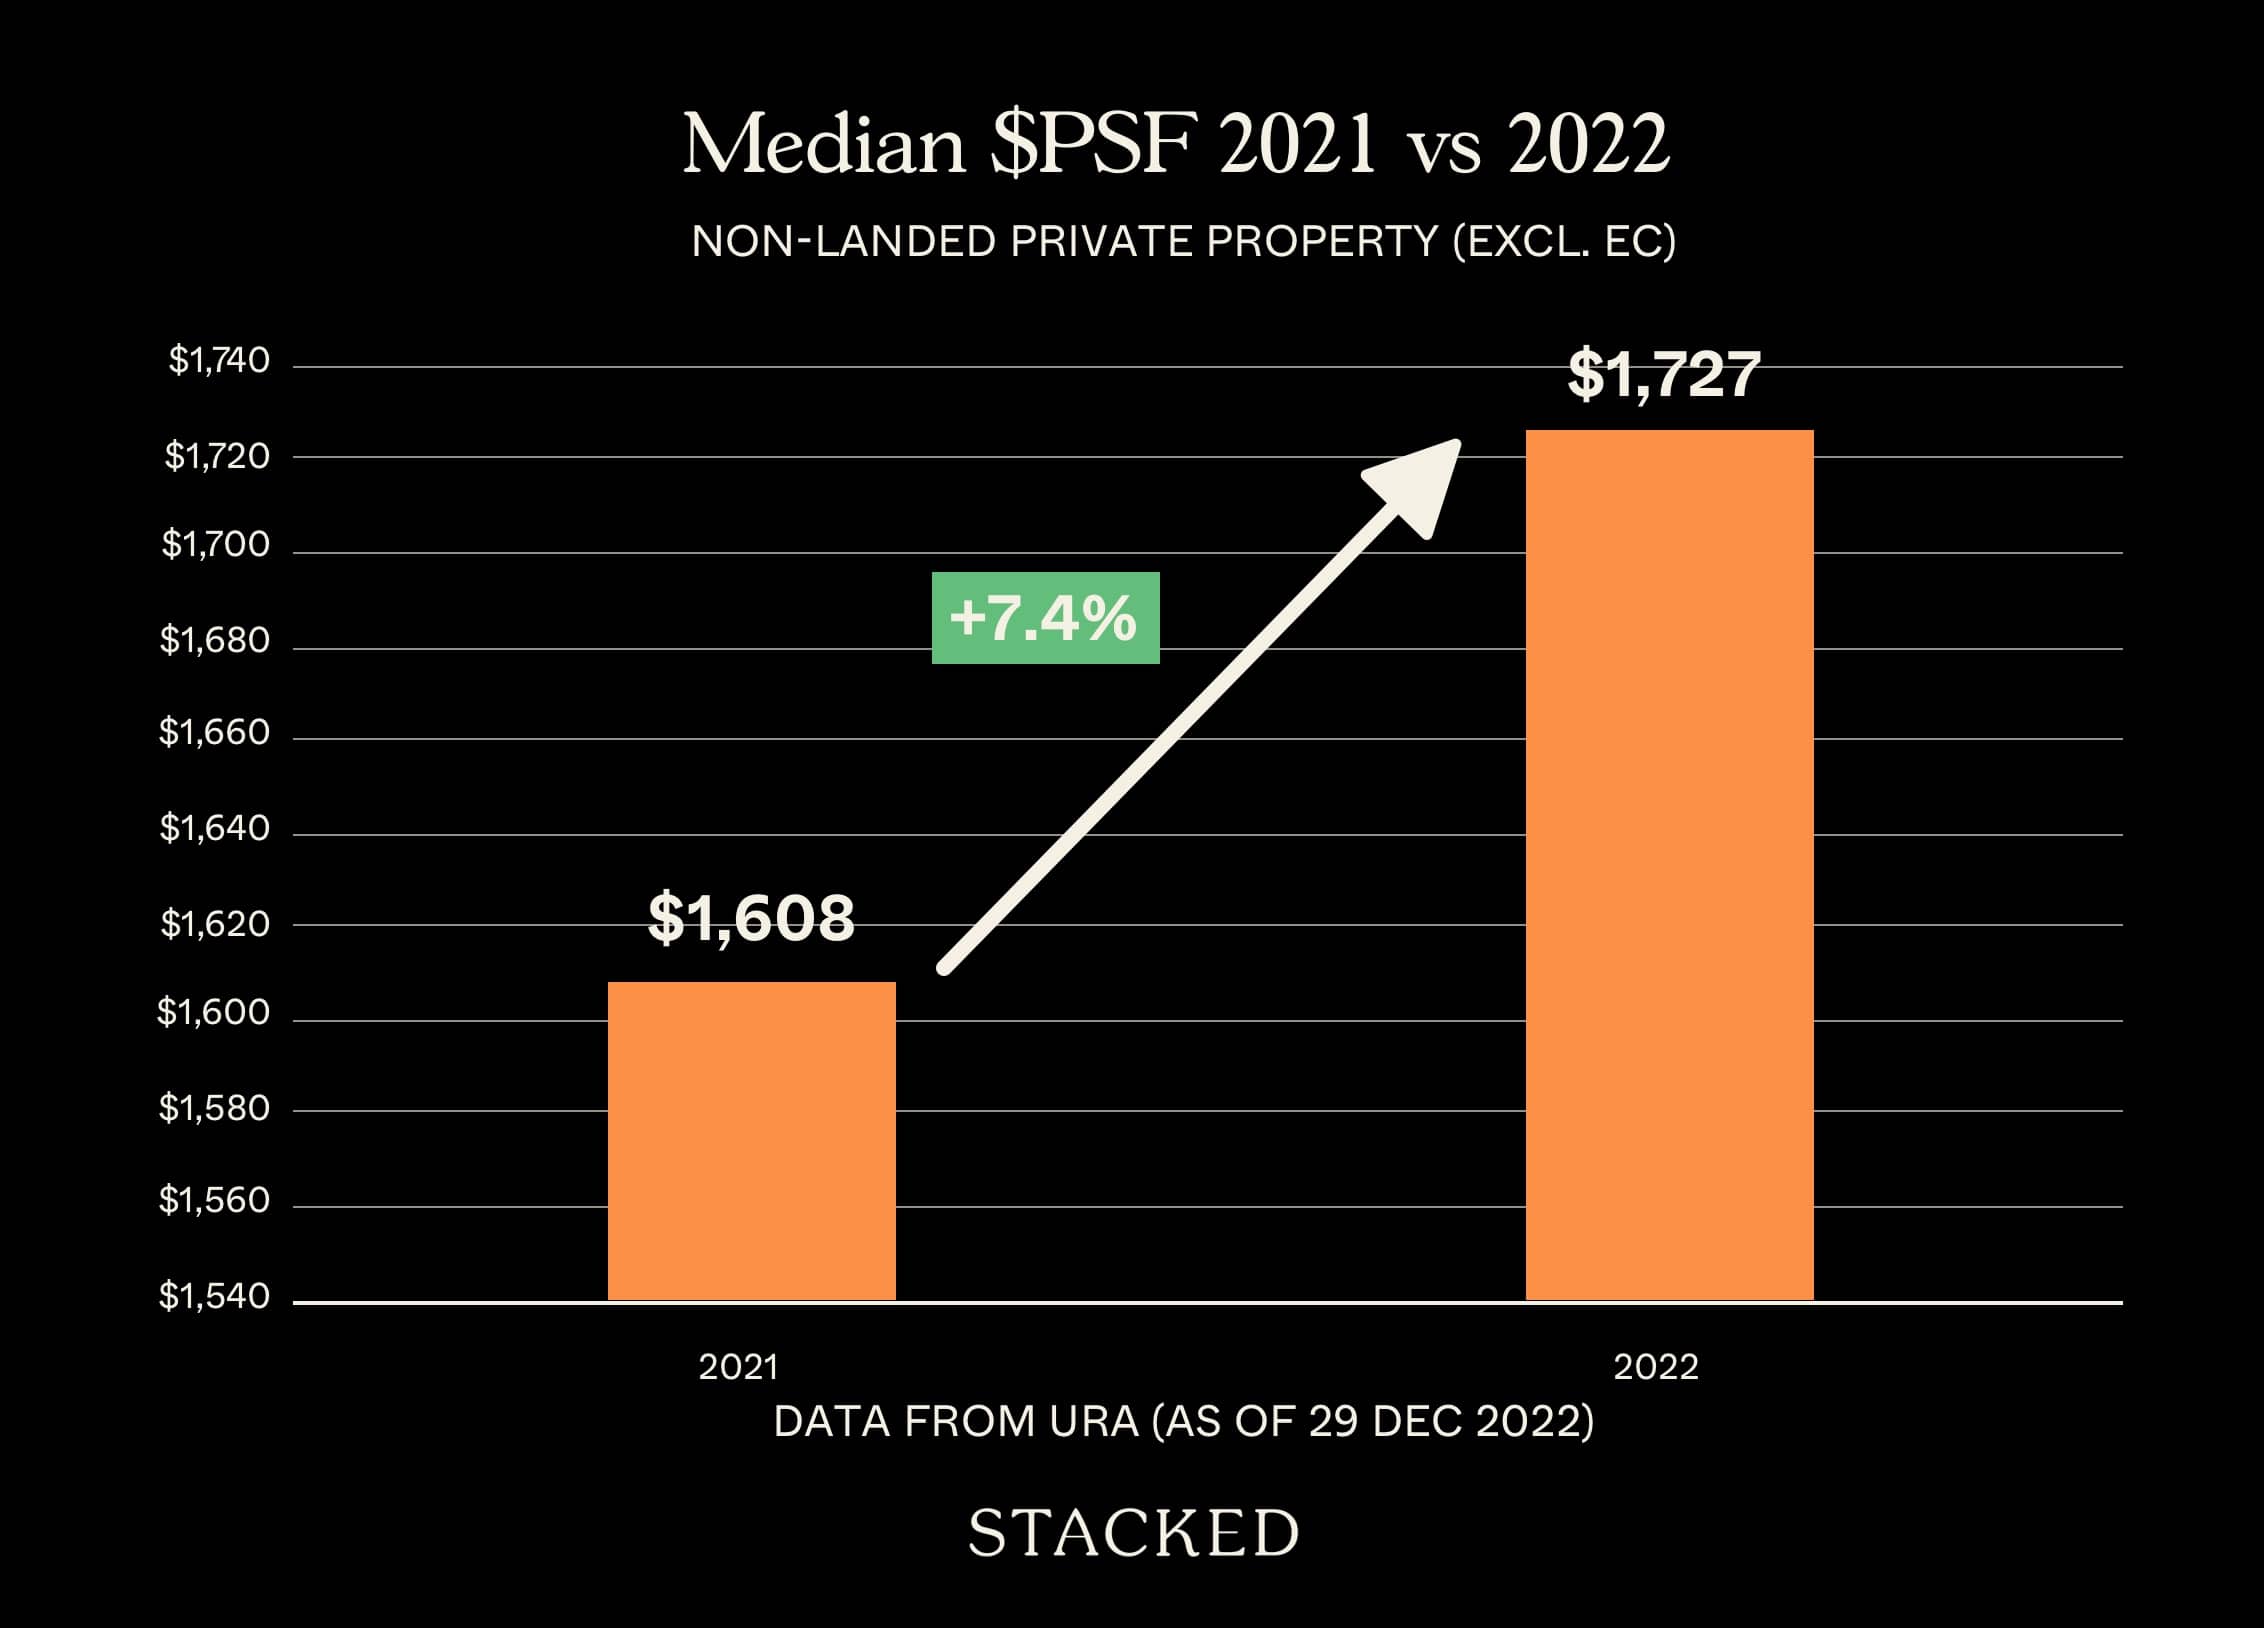
Prices have continued to rise, despite the two recent cooling measures and falling transactions.
The median price in 2022 stood at $1,727 psf, up 7.4 per cent from $1,608 the previous year.
| Region | Sales volume (2021) | Price psf (2021) | Sales volume (2022) | Price psf (2022) | Approx. gain / loss |
| Singapore | 29,438 | $1,608 | 19,111 | $1,727 | +7.4% |
| CCR | 5,674 | $2,360 | 3,943 | $2,508 | +6.2% |
| RCR | 10,247 | $1,771 | 6,367 | $1,859 | +4.9% |
| OCR | 13,517 | $1,322 | 13,517 | $1,394 | +5.4% |
All new launch developments throughout 2022
The following is based on URA November Developer Sales data added with transactions from December 2022. For the most current details on pricing, take-up rates, etc. do drop us a query.
| Project Name | Total Number of Units in Project | Cumulative Units Sold to-date | Lowest PSF in 2022 | Highest PSF in 2022 | Median $PSF in 2022 | Take-Up Rate |
| AMBER SEA | 132 | 0 | – | – | – | 0.00% |
| GEMS VILLE | 24 | 0 | – | – | – | 0.00% |
| K SUITES | 19 | 0 | – | – | – | 0.00% |
| MATTAR RESIDENCES | 26 | 0 | – | – | – | 0.00% |
| SANCTUARY@NEWTON | 38 | 0 | – | – | – | 0.00% |
| SOPHIA REGENCY | 38 | 0 | – | – | – | 0.00% |
| SUNSTONE HILL | 28 | 0 | – | – | – | 0.00% |
| THE ARDEN | 105 | 0 | – | – | – | 0.00% |
| CAIRNHILL 16 | 39 | 1 | $2,700 | $2,700 | $2,700 | 2.56% |
| POLLEN COLLECTION | 132 | 4 | $1,407 | $2,191 | $1,860 | 3.03% |
| 19 NASSIM | 101 | 4 | – | – | – | 3.96% |
| KLIMT CAIRNHILL | 138 | 7 | $3,574 | $3,850 | $3,714 | 5.07% |
| CUSCADEN RESERVE | 192 | 10 | $3,830 | $3,830 | $3,830 | 5.21% |
| JERVOIS TREASURES | 36 | 2 | – | – | – | 5.56% |
| JERVOIS PRIVE | 43 | 3 | $2,672 | $2,767 | $2,720 | 6.98% |
| ENCHANTE | 25 | 2 | $2,647 | $2,703 | $2,675 | 8.00% |
| KOVAN JEWEL | 34 | 4 | $2,063 | $2,200 | $2,120 | 11.76% |
| THE ATELIER | 120 | 20 | $2,530 | $2,798 | $2,600 | 16.67% |
| HILL HOUSE | 72 | 13 | $2,783 | $3,168 | $3,031 | 18.06% |
| GRANGE 1866 | 60 | 11 | $2,869 | $3,007 | $2,929 | 18.33% |
| ONE DRAYCOTT | 64 | 13 | $3,062 | $3,249 | $3,180 | 20.31% |
| PARKSUITES | 119 | 28 | $2,137 | $2,354 | $2,272 | 23.53% |
| DALVEY HAUS | 17 | 4 | – | – | – | 23.53% |
| IKIGAI | 16 | 5 | $2,121 | $2,281 | $2,189 | 31.25% |
| 10 EVELYN | 56 | 18 | $1,913 | $2,837 | $2,611 | 32.14% |
| THE CARRARA | 6 | 2 | $3,003 | $3,003 | $3,003 | 33.33% |
| THE JARDINE RESIDENCES | 6 | 2 | $2,957 | $2,957 | $2,957 | 33.33% |
| NORTH GAIA | 616 | 207 | $1,179 | $1,438 | $1,297 | 33.60% |
| ONE BERNAM | 351 | 139 | $2,251 | $3,168 | $2,452 | 39.60% |
| MIDTOWN BAY | 219 | 94 | $2,657 | $3,454 | $3,237 | 42.92% |
| PEAK RESIDENCE | 90 | 43 | $2,300 | $2,872 | $2,402 | 47.78% |
| SPRING WATERS VILLAS | 6 | 3 | $1,706 | $1,842 | $1,710 | 50.00% |
| BOTANIC @ CLUNY PARK | 6 | 3 | – | – | – | 50.00% |
| THE LANDMARK | 396 | 206 | $2,118 | $2,787 | $2,413 | 52.02% |
| VAN HOLLAND | 69 | 40 | $2,739 | $3,106 | $2,884 | 57.97% |
| ZYANYA | 34 | 20 | $1,620 | $2,091 | $1,873 | 58.82% |
| ROYAL HALLMARK | 32 | 19 | $1,728 | $2,237 | $1,932 | 59.38% |
| PULLMAN RESIDENCES NEWTON | 340 | 215 | $2,683 | $3,300 | $3,011 | 63.24% |
| ATLASSIA | 31 | 20 | $1,901 | $2,206 | $2,080 | 64.52% |
| BARTLEY VUE | 115 | 75 | $1,725 | $2,205 | $1,936 | 65.22% |
| MOOI RESIDENCES | 24 | 16 | $2,339 | $2,669 | $2,498 | 66.67% |
| THE LILIUM | 80 | 54 | $1,918 | $2,406 | $2,241 | 67.50% |
| BAYWIND RESIDENCES | 24 | 17 | $1,953 | $2,155 | $2,080 | 70.83% |
| TENET | 618 | 446 | $1,185 | $1,467 | $1,381 | 72.17% |
| MYRA | 85 | 64 | $2,076 | $2,428 | $2,228 | 75.29% |
| HYLL ON HOLLAND | 319 | 241 | $2,448 | $2,971 | $2,672 | 75.55% |
| PERFECT TEN | 230 | 174 | $2,649 | $3,585 | $2,951 | 75.65% |
| WILSHIRE RESIDENCES | 85 | 65 | $2,500 | $2,825 | $2,704 | 76.47% |
| BELGRAVIA ACE | 107 | 82 | $1,012 | $1,127 | $1,080 | 76.64% |
| SKY EDEN@BEDOK | 158 | 122 | $1,854 | $2,286 | $2,118 | 77.22% |
| ONE HOLLAND VILLAGE RESIDENCES | 296 | 232 | $2,334 | $3,426 | $2,795 | 78.38% |
| LES MAISONS NASSIM | 14 | 11 | $4,953 | $6,057 | $5,461 | 78.57% |
| LEEDON GREEN | 638 | 502 | $2,462 | $3,139 | $2,816 | 78.68% |
| SERAYA RESIDENCES | 17 | 14 | – | – | – | 82.35% |
| THE GAZANIA | 250 | 207 | $1,810 | $2,606 | $2,200 | 82.80% |
| HAUS ON HANDY | 188 | 156 | $2,571 | $2,811 | $2,674 | 82.98% |
| LIV @ MB | 298 | 248 | $2,079 | $2,869 | $2,423 | 83.22% |
| BRIGHTHILL RESIDENCES | 6 | 5 | $2,818 | $2,937 | $2,900 | 83.33% |
| MIDTOWN MODERN | 558 | 469 | $2,501 | $4,783 | $2,755 | 84.05% |
| PICCADILLY GRAND | 407 | 344 | $1,870 | $2,593 | $2,168 | 84.52% |
| PARK NOVA | 54 | 46 | $4,426 | $4,896 | $4,600 | 85.19% |
| LENTOR MODERN | 605 | 519 | $1,837 | $2,513 | $2,107 | 85.79% |
| BOULEVARD 88 | 154 | 134 | $3,610 | $4,121 | $4,002 | 87.01% |
| RIVIERE | 455 | 400 | $2,307 | $3,344 | $2,876 | 87.91% |
| SLOANE RESIDENCES | 52 | 46 | $2,664 | $3,193 | $2,891 | 88.46% |
| 15 HOLLAND HILL | 57 | 51 | $3,003 | $3,141 | $3,064 | 89.47% |
| CASHEW GREEN | 19 | 17 | $1,735 | $1,960 | $1,848 | 89.47% |
| MORI | 137 | 123 | $1,645 | $2,165 | $1,908 | 89.78% |
| THE AVENIR | 376 | 338 | $2,842 | $3,515 | $3,233 | 89.89% |
| ONE PEARL BANK | 774 | 702 | $2,189 | $2,973 | $2,566 | 90.70% |
| KOPAR AT NEWTON | 378 | 345 | $2,227 | $2,841 | $2,517 | 91.27% |
| NEU AT NOVENA | 87 | 80 | $2,676 | $3,046 | $2,694 | 91.95% |
| THE REEF AT KING’S DOCK | 429 | 397 | $2,175 | $2,637 | $2,429 | 92.54% |
| ONE TREE HILL COLLECTION | 14 | 13 | $3,134 | $3,676 | $3,405 | 92.86% |
| IRWELL HILL RESIDENCES | 540 | 506 | $2,589 | $3,106 | $2,881 | 93.70% |
| URBAN TREASURES | 237 | 223 | $1,873 | $2,127 | $2,006 | 94.09% |
| ASPEN LINQ | 18 | 17 | – | – | – | 94.44% |
| PHOENIX RESIDENCES | 74 | 70 | $1,451 | $1,689 | $1,594 | 94.59% |
| THE M | 522 | 495 | $2,302 | $3,193 | $2,792 | 94.83% |
| PASIR RIS 8 | 487 | 463 | $1,610 | $2,100 | $1,816 | 95.07% |
| MEYER MANSION | 200 | 191 | $2,460 | $3,170 | $2,627 | 95.50% |
| 35 GILSTEAD | 70 | 67 | $2,057 | $2,686 | $2,570 | 95.71% |
| THE COMMODORE | 219 | 211 | $1,309 | $1,667 | $1,493 | 96.35% |
| KI RESIDENCES AT BROOKVALE | 660 | 637 | $1,720 | $2,263 | $2,016 | 96.52% |
| CANNINGHILL PIERS | 696 | 673 | $2,560 | $4,419 | $2,850 | 96.70% |
| RYMDEN 77 | 31 | 30 | $1,433 | $1,816 | $1,770 | 96.77% |
| FORETT AT BUKIT TIMAH | 633 | 619 | $1,810 | $2,409 | $2,131 | 97.79% |
| PARC CLEMATIS | 1468 | 1439 | $1,076 | $2,073 | $1,791 | 98.02% |
| 1953 | 58 | 57 | $1,785 | $2,113 | $1,907 | 98.28% |
| THE HYDE | 117 | 115 | $2,732 | $3,378 | $3,009 | 98.29% |
| AMBER PARK | 592 | 582 | $2,243 | $2,694 | $2,481 | 98.31% |
| AMO RESIDENCE | 372 | 367 | $1,890 | $2,406 | $2,110 | 98.66% |
| THE WATERGARDENS AT CANBERRA | 448 | 443 | $1,288 | $1,593 | $1,456 | 98.88% |
| UPTOWN @ FARRER | 116 | 115 | $1,529 | $1,717 | $1,617 | 99.14% |
| AFFINITY AT SERANGOON | 1052 | 1044 | $1,104 | $1,748 | $1,531 | 99.24% |
| PARK COLONIAL | 805 | 800 | – | – | – | 99.38% |
| KENT RIDGE HILL RESIDENCES | 548 | 545 | $1,451 | $2,154 | $1,844 | 99.45% |
| MAYFAIR GARDENS | 215 | 214 | $1,932 | $2,277 | $2,059 | 99.53% |
| RIVERFRONT RESIDENCES | 1472 | 1466 | $1,099 | $1,464 | $1,288 | 99.59% |
| SKY EVERTON | 262 | 261 | $2,787 | $3,406 | $2,862 | 99.62% |
| DAIRY FARM RESIDENCES | 460 | 459 | $1,359 | $1,895 | $1,686 | 99.78% |
| PARC CANBERRA | 496 | 495 | – | – | – | 99.80% |
| JERVOIS MANSION | 130 | 104 | $2,177 | $2,553 | $2,374 | 100.00% |
| 77 @ EAST COAST | 41 | 41 | $1,631 | $1,858 | $1,753 | 100.00% |
| AVENUE SOUTH RESIDENCE | 1074 | 1074 | $1,914 | $2,623 | $2,357 | 100.00% |
| CASA AL MARE | 49 | 49 | $1,710 | $1,768 | $1,739 | 100.00% |
| CLAVON | 640 | 640 | $1,562 | $1,805 | $1,702 | 100.00% |
| COASTLINE RESIDENCES | 144 | 144 | $2,646 | $2,936 | $2,833 | 100.00% |
| DUNEARN 386 | 35 | 35 | $2,552 | $2,614 | $2,561 | 100.00% |
| FOURTH AVENUE RESIDENCES | 476 | 476 | $2,339 | $2,728 | $2,500 | 100.00% |
| FYVE DERBYSHIRE | 71 | 71 | $2,400 | $2,696 | $2,537 | 100.00% |
| INFINI AT EAST COAST | 36 | 36 | $1,935 | $2,101 | $2,035 | 100.00% |
| JADESCAPE | 1206 | 1206 | $1,561 | $1,910 | $1,772 | 100.00% |
| LA MARIPOSA | 17 | 17 | $1,764 | $1,976 | $1,922 | 100.00% |
| M SUITES | 16 | 16 | $1,600 | $1,708 | $1,656 | 100.00% |
| MAYFAIR MODERN | 171 | 171 | $1,859 | $2,359 | $2,217 | 100.00% |
| MIDWOOD | 564 | 564 | $1,592 | $1,869 | $1,710 | 100.00% |
| MONT BOTANIK RESIDENCE | 108 | 108 | $1,586 | $1,856 | $1,803 | 100.00% |
| NORMANTON PARK | 1862 | 1862 | $1,493 | $1,993 | $1,865 | 100.00% |
| NYON | 92 | 92 | $2,016 | $2,551 | $2,175 | 100.00% |
| ONE MEYER | 66 | 66 | $2,419 | $2,711 | $2,542 | 100.00% |
| PARC CENTRAL RESIDENCES | 700 | 700 | $1,165 | $1,281 | $1,207 | 100.00% |
| PARC ESTA | 1399 | 1399 | $2,201 | $2,201 | $2,201 | 100.00% |
| PARC GREENWICH | 496 | 496 | $1,105 | $1,368 | $1,244 | 100.00% |
| PARC KOMO | 276 | 276 | $1,478 | $1,840 | $1,627 | 100.00% |
| PARKWOOD COLLECTION | 53 | 53 | $737 | $832 | $795 | 100.00% |
| PARKWOOD RESIDENCES | 18 | 18 | $1,439 | $1,751 | $1,576 | 100.00% |
| PIERMONT GRAND | 820 | 820 | $1,298 | $1,350 | $1,334 | 100.00% |
| PROVENCE RESIDENCE | 413 | 413 | $1,047 | $1,357 | $1,252 | 100.00% |
| RESIDENCE TWENTY-TWO | 22 | 22 | $1,874 | $1,915 | $1,895 | 100.00% |
| SENGKANG GRAND RESIDENCES | 680 | 680 | $1,681 | $1,913 | $1,817 | 100.00% |
| STIRLING RESIDENCES | 1259 | 1259 | $2,606 | $2,635 | $2,621 | 100.00% |
| THE ANTARES | 265 | 265 | $1,894 | $1,894 | $1,894 | 100.00% |
| THE FLORENCE RESIDENCES | 1410 | 1410 | $1,384 | $2,106 | $1,737 | 100.00% |
| THE IVERIA | 51 | 51 | $2,473 | $2,682 | $2,543 | 100.00% |
| THE WOODLEIGH RESIDENCES | 667 | 667 | $1,977 | $2,398 | $2,178 | 100.00% |
| VERDALE | 258 | 258 | $1,725 | $1,981 | $1,829 | 100.00% |
| VERTICUS | 162 | 162 | $1,963 | $2,321 | $2,165 | 100.00% |
| COPEN GRAND | 639 | 639 | $1,157 | $1,449 | $1,339 | 100.00% |
| BURGHLEY DRIVE | 5 | 5 | – | – | – | 100.00% |
| WATERCOVE | 80 | 80 | – | – | – | 100.00% |
Top 5 selling developments in 2022
| Top 5 Selling New Launches in 2022 | No. of Units | Median $PSF 2022 | Median Price 2022 | Tenure |
| COPEN GRAND | 639 | $1,339.0 | $1,356,000 | 99 yrs from 31/08/2021 |
| LENTOR MODERN | 519 | $2,107.0 | $1,681,020 | 99 yrs from 26/10/2021 |
| TENET | 446 | $1,381.0 | $1,398,500 | 99 years leasehold |
| NORMANTON PARK | 376 | $1,864.5 | $1,786,500 | 99 yrs from 22/07/2019 |
| AMO RESIDENCE | 367 | $2,110.0 | $1,750,000 | 99 yrs from 30/08/2021 |
Best-selling CCR new launch
| Best Selling CCR New Launch | No. of Units | Median $PSF 2022 | Median Price 2022 | Tenure |
| LEEDON GREEN | 186 | $2,815.5 | $1,907,000 | Freehold |
| PERFECT TEN | 161 | $2,951.0 | $2,420,000 | Freehold |
| THE AVENIR | 138 | $3,232.5 | $3,760,500 | Freehold |
| HYLL ON HOLLAND | 130 | $2,672.0 | $1,879,850 | Freehold |
| KOPAR AT NEWTON | 109 | $2,517.0 | $2,643,300 | 99 yrs from 22/04/2019 |
Best-selling RCR new launch
| Best Selling RCR New Launch | No. of Units | Median $PSF 2022 | Median Price 2022 | Tenure |
| NORMANTON PARK | 376 | $1,864.5 | $1,786,500 | 99 yrs from 22/07/2019 |
| PICCADILLY GRAND | 344 | $2,168.0 | $1,571,000 | 99 yrs from 02/08/2021 |
| LIV @ MB | 248 | $2,423.0 | $2,035,000 | 99 yrs from 23/11/2021 |
| RIVIERE | 200 | $2,875.5 | $3,037,500 | 99 yrs from 07/03/2018 |
| ONE PEARL BANK | 171 | $2,566.0 | $2,140,000 | 99 yrs from 01/03/2019 |
Best-selling OCR new launch
| Best Selling OCR New Launch | No. of Units | Median $PSF 2022 | Median Price 2022 | Tenure |
| COPEN GRAND | 639 | $1,339.0 | $1,356,000 | 99 yrs from 31/08/2021 |
| LENTOR MODERN | 519 | $2,107.0 | $1,681,020 | 99 yrs from 26/10/2021 |
| TENET | 446 | $1,381.0 | $1,398,500 | 99 years leasehold |
| AMO RESIDENCE | 367 | $2,110.0 | $1,750,000 | 99 yrs from 30/08/2021 |
| NORTH GAIA | 206 | $1,296.5 | $1,375,000 | 99 yrs from 15/02/2021 |
Top 5 non-landed private properties for resale gains in 2022
| Project | Sale Date | Transacted | Quantum Gains | % Gain | Holding Period (Years) |
| WESTCOVE CONDOMINIUM | 5/23/2022 | $1,060,000 | $953,000 | 891% | 23 |
| HILLVIEW GREEN | 3/22/2022 | $1,640,000 | $1,265,000 | 337% | 23 |
| BOTANIC GARDENS VIEW | 4/7/2022 | $3,750,000 | $2,871,600 | 327% | 24 |
| JOO CHIAT MANSIONS | 4/1/2022 | $1,700,000 | $1,290,000 | 315% | 16 |
| IVORY HEIGHTS | 13/9/22 | 1780000 | $435,000 | 309% | 19 |
Bottom 5 private properties for resale gains in 2022
| Project | Sale Date | Transacted | Quantum Loss | % Loss | Holding Period (Years) |
| HELIOS RESIDENCES | 18/1/22 | $2,800,000 | -$2,056,600 | -42% | 9 |
| REFLECTIONS AT KEPPEL BAY | 29/4/22 | $5,850,000 | -$4,131,000 | -41% | 15 |
| THE SCOTTS TOWER | 25/10/22 | $1,300,000 | -$900,500 | -41% | 10 |
| MARINA BAY SUITES | 16/8/22 | $5,000,000 | -$3,250,000 | -39% | 9 |
| SEASCAPE | 21/10/22 | $5,900,000 | -$3,700,000 | -39% | 12 |
Rental market for private non-landed properties
2022 has seen one of the best rental markets in six years for landlords, so don’t be misled by the fall in leasing volume. This could also just be due to the lack of supply, hence the demand and increasing prices – this is expected to clear up in 2023 as a bumper crop of new launches gets completed.
Overall leasing volume fell about 17 per cent, to 78,325 leases from 94,393 the year before.
In leasing volume by region, the RCR saw the smallest decrease. There was around a 14 per cent drop only, to 26,298. The CCR and OCR saw a similar loss of volume, with both dipping by just over 18 per cent.
Volume aside, rental rates are on a clear uptrend.
The OCR saw the biggest increase as foreign workers returned, and locals began to rent while waiting completion of their own homes. Prices are up around 20 per cent, from $2.90 psf to $3.49 psf.
The RCR saw the next highest increase of around 19.2 per cent, from $3.59 to $4.28 psf.
The CCR saw the slightest increase, but it was still tangible as prices rose 17.1 per, from $4.14 to $4.85 psf.
| Leasing volume by region | 2021 | 2022 | Change |
| CCR | 28,250 | 22,992 | -18.61% |
| RCR | 30,500 | 26,298 | -13.78% |
| OCR | 35,643 | 29,035 | -18.54% |
| Leasing price by region | 2021 | 2022 | Change |
| CCR | $4.14 | $4.85 | +17.15% |
| RCR | $3.59 | $4.28 | +19.22% |
| OCR | $2.90 | $3.49 | +20.34% |
Top 5 developments for rental yield in 2022
| District | Project | Tenure | Completion | Average Price | No. of Transactions | Average Rent ($PSF PM) | # Rental Contracts | Yield (%) |
| 21 | THE HILLFORD | 60 YRS FROM 2013 | 2016 | 1,293 | 27 | 5.82 | 126 | 5.4 |
| 14 | LE REGAL | FREEHOLD | 2015 | 1,150 | 4 | 5.07 | 46 | 5.3 |
| 14 | TREASURES @ G20 | FREEHOLD | 2015 | 1,237 | 4 | 4.93 | 21 | 4.8 |
| 5 | VIVA VISTA | FREEHOLD | 2014 | 1,626 | 8 | 6.34 | 110 | 4.7 |
| 14 | # 1 SUITES | FREEHOLD | 2016 | 1,141 | 7 | 4.43 | 26 | 4.7 |
Bottom 5 developments for rental yield in 2022
| District | Project | Tenure | Completion | Average Price | No. of Transactions | Average Rent ($PSF PM) | # Rental Contracts | Yield (%) |
| 15 | EAST COURT | FREEHOLD | 1983 | 1,499 | 8 | 1.7 | 5 | 1.4 |
| 10 | FOUR SEASONS PARK | FREEHOLD | 1994 | 3,162 | 4 | 4.49 | 46 | 1.7 |
| 10 | ARDMORE PARK | FREEHOLD | 2001 | 4,051 | 8 | 5.75 | 100 | 1.7 |
| 4 | TERESA VILLE | FREEHOLD | 1986 | 1,627 | 6 | 2.3 | 52 | 1.7 |
| 10 | NASSIM MANSION | FREEHOLD | 1977 | 2,857 | 5 | 4.02 | 6 | 1.7 |
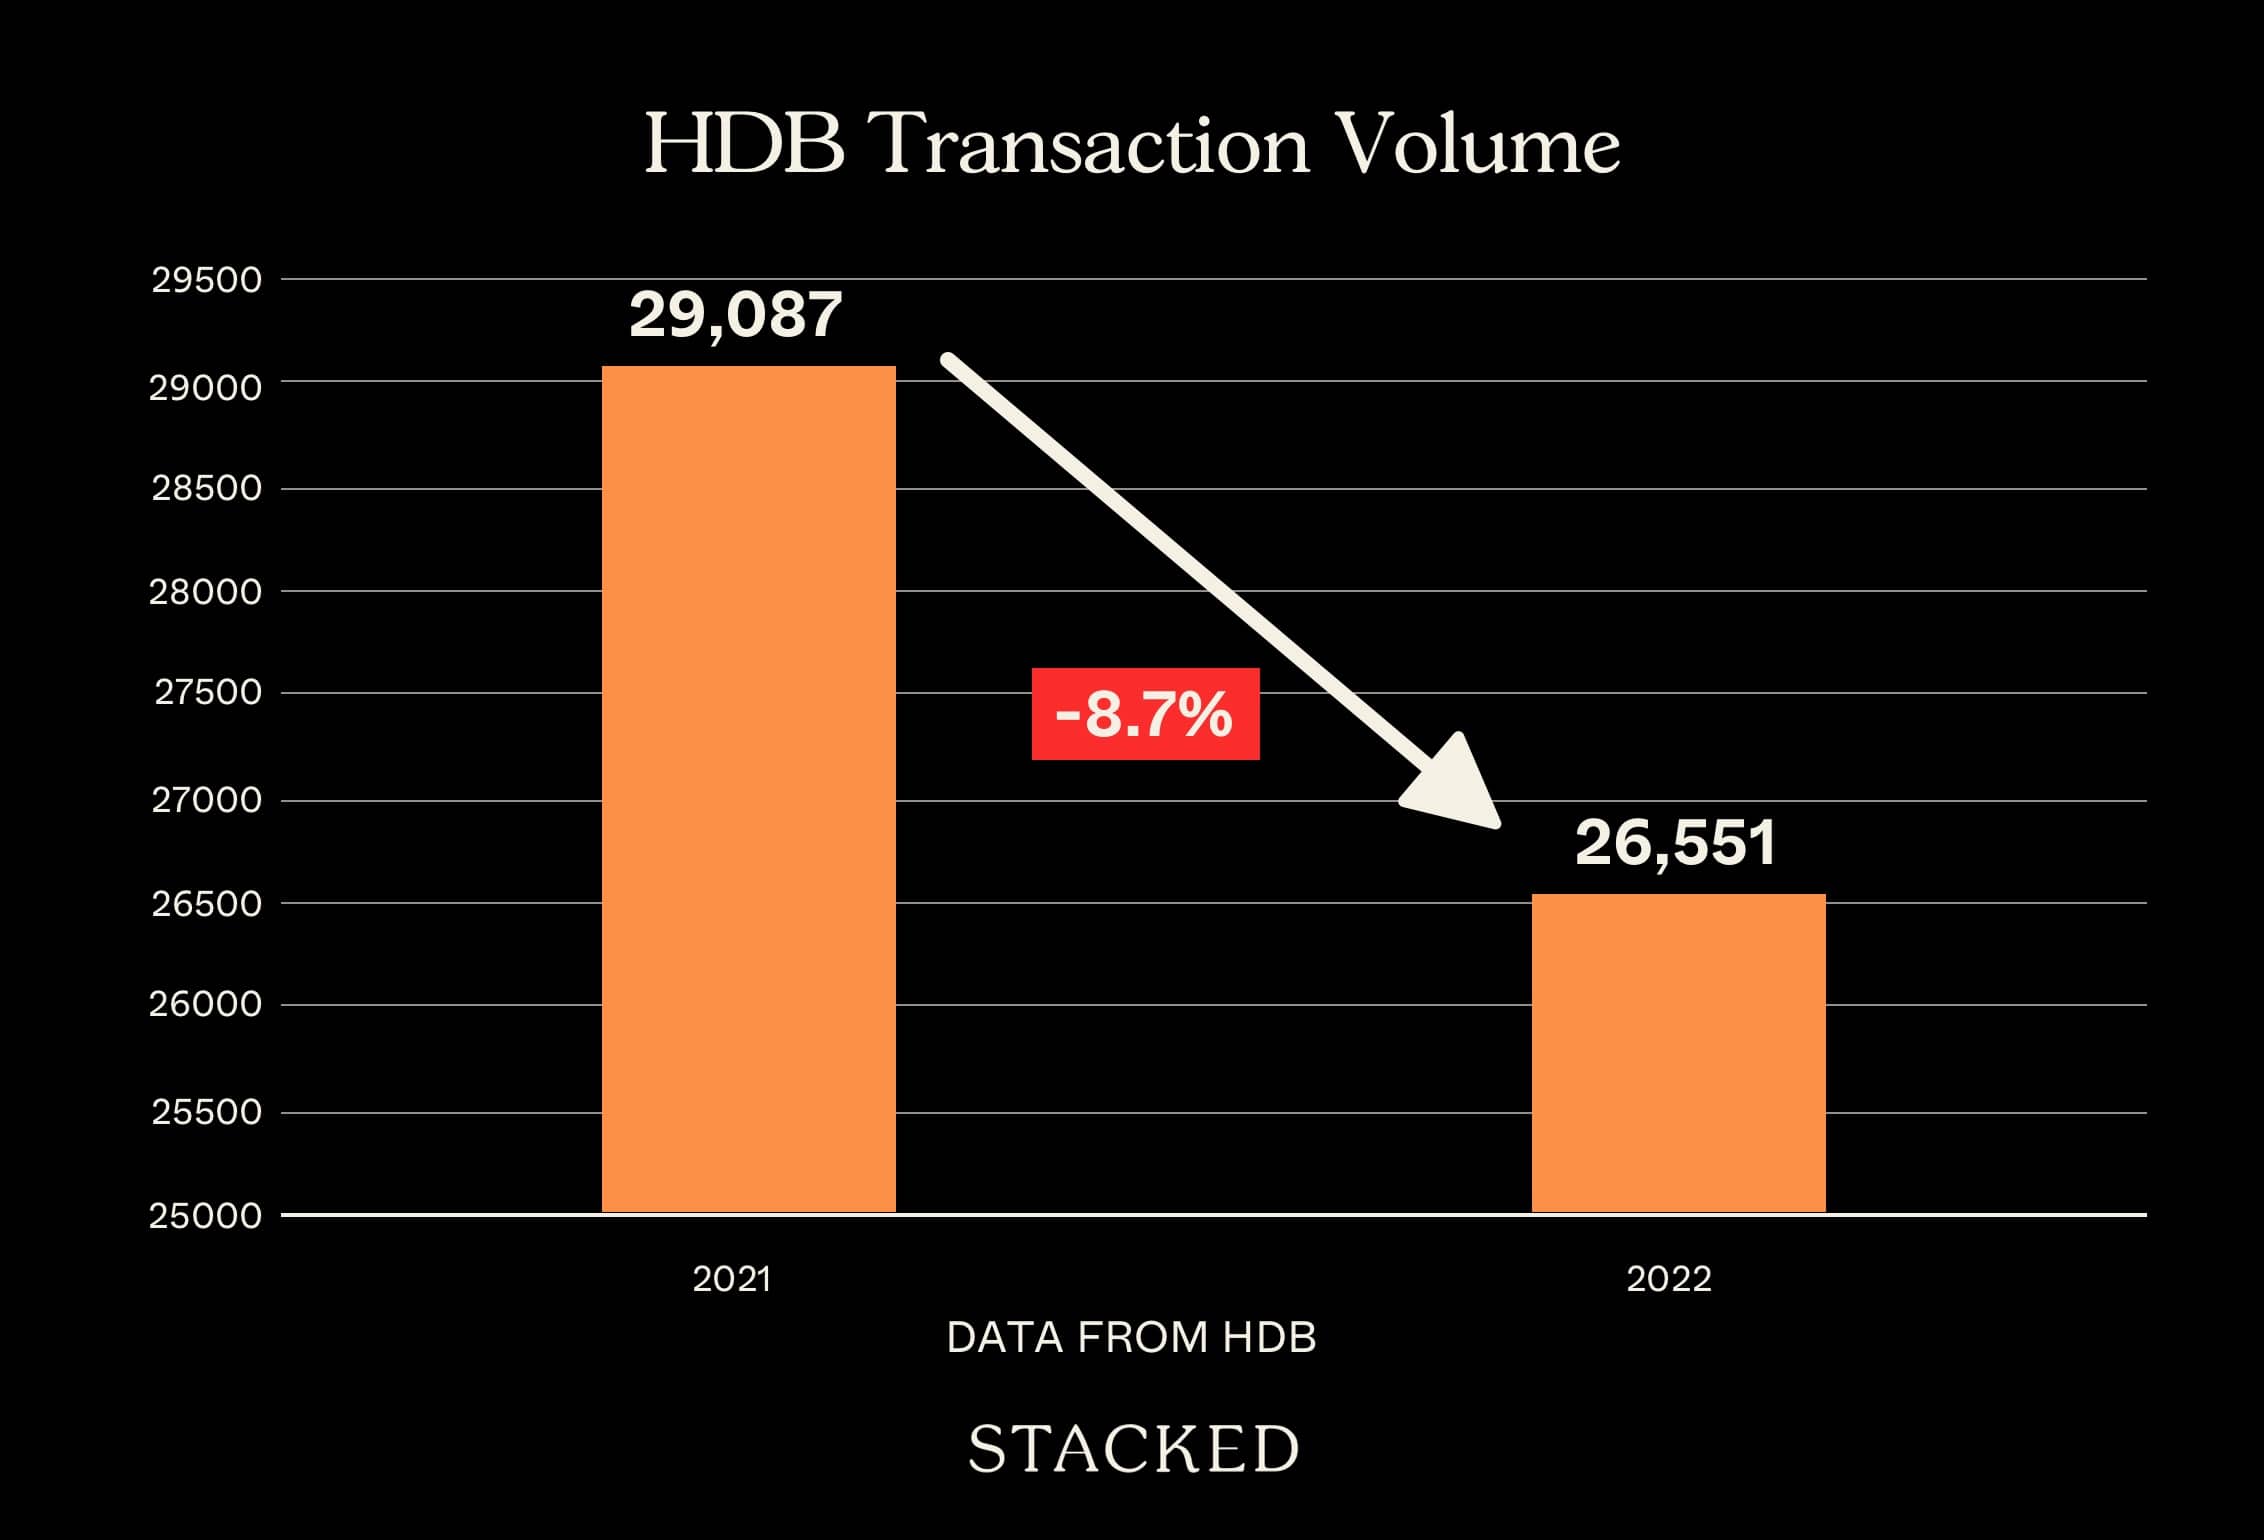
HDB resale market
Resale flat transactions saw a small dip in volume, from 29,087 units to 26,551 units – a decrease of around 8.7 per cent.

2-room flat transactions rose around 18 per cent, to about 454 units, whilst 3-room flats saw almost unchanged volume at 6,316 units (up by less than a percentage point).
The larger flats, 4-room, 5-room, and EAs, all saw drops in volume; so we may soon be seeing the ceiling for resale flat prices.
4-room flat transactions fell 9.12 per cent, to 1,120 units, while 5-room transactions fell 14.5 per cent to 6,672 transactions. EAs saw the biggest decline in volume, falling 17.35 per cent to 1,867 units.
As with the previous year, HDB flat prices continue their unprecedented rise across the board. This is almost comparable to the pace we saw last year; so if there’s any slowing in the momentum, it’s more visible in the transaction volumes than the prices.
| Flat Type | 2021 Vol | 2021 $PSF | 2022 Vol | 2022 $PSF | Approx Gain/Loss |
| 1 ROOM | 9 | $591 | 10 | $692 | +17.07% |
| 2 ROOM | 385 | $537 | 454 | $603 | +12.40% |
| 3 ROOM | 6266 | $483 | 6316 | $532 | +10.32% |
| 4 ROOM | 12346 | $499 | 11220 | $541 | +8.35% |
| 5 ROOM | 7804 | $480 | 6672 | $519 | +8.00% |
| EXECUTIVE | 2259 | $453 | 1867 | $499 | +10.19% |
| MULTI-GENERATION | 18 | $491 | 12 | $513 | +4.46% |
BTO launches in 2022
| Town | BTO | Launch | Est. Completion | Units |
| Geylang | Dakota Crest | 17 Feb 2022 | 4Q 2027 | 443 |
| Kallang/Whampoa | King George’s Heights (PLH) | 17 Feb 2022 | 3Q 2027 | 398 |
| Tengah | Parc Flora @ Tengah | 17 Feb 2022 | 3Q 2025 | 560 |
| Tengah | Plantation Creek | 17 Feb 2022 | 2Q 2026 | 713 |
| Yishun | Grove Spring @ Yishun | 17 Feb 2022 | 4Q 2024 | 987 |
| Yishun | Yishun Boardwalk | 17 Feb 2022 | 2Q 2025 | 852 |
| Bukit Merah | Bukit Merah Ridge (PLH) | 27 May 2022 | 1Q 2028 | 1669 |
| Jurong West | Lakeside View | 27 May 2022 | 4Q 2026 | 1016 |
| Queenstown | Ghim Moh Ascent (PLH) | 27 May 2022 | 1Q 2028 | 867 |
| Toa Payoh | Kim Keat Heights | 27 May 2022 | 3Q 2027 | 385 |
| Yishun | Yishun Beacon | 27 May 2022 | 2Q 2026 | 646 |
| Ang Mo Kio | Central Weave @ AMK | 30 Aug 2022 | 2Q 2028 | 896 |
| Bukit Merah | Alexandra Vale (PLH) | 30 Aug 2022 | 2Q 2028 | 782 |
| Bukit Merah | Havelock Hillside (PLH) | 30 Aug 2022 | 4Q 2028 | 869 |
| Choa Chu Kang | Keat Hong Grange | 30 Aug 2022 | 4Q 2026 | 987 |
| Jurong East | Jurong East Breeze | 30 Aug 2022 | 2Q 2028 | 562 |
| Tampines | Sun Plaza Spring | 30 Aug 2022 | 2Q 2026 | 267 |
| Woodlands | Woodlands South Plains | 30 Aug 2022 | 1Q 2027 | 630 |
| Bukit Batok | West Glades @ Bukit Batok | 23 Nov 2022 | 1Q 2028 | 790 |
| Kallang/Whampoa | Kallang Horizon (PLH) | 23 Nov 2022 | 1Q 2028 | 477 |
| Queenstown | Ghim Moh Natura (PLH) | 23 Nov 2022 | 1Q 2028 | 991 |
| Queenstown | Queensway Canopy | 23 Nov 2022 | 4Q 2028 | 751 |
| Queenstown | Ulu Pandan Banks (PLH) | 23 Nov 2022 | 3Q 2029 | 1330 |
| Tengah | Garden Waterfront I & II @ Tengah | 23 Nov 2022 | 1Q 2027 | 2077 |
| Yishun | Aranda Breeze @ Yishun | 23 Nov 2022 | 2Q 2028 | 699 |
| Yishun | Miltonia Breeze @ Yishun | 23 Nov 2022 | 2Q 2029 | 1334 |
| Yishun | Vanda Breeze @ Yishun | 23 Nov 2022 | 2Q 2029 | 961 |
Executive Condominium (EC) launches in 2022
| Project | Units | Units Sold-To-Date | Lowest $PSF In 2022 | Highest $PSF In 2022 | Median $PSF In 2022 | Take-Up |
| Copen Grand | 639 | 639 | $1,157 | $1,449 | $1,339 | 100.00% |
| North Gaia | 616 | 207 | $1,179 | $1,438 | $1,297 | 33.60% |
| Tenet | 618 | 446 | $1,185 | $1,467 | $1,381 | 72.17% |
Policy changes in 2022
The significant policy change for the year was the September 2022 cooling measures. We have more extensive details here. But to summarise:
- For the purposes of calculating TDSR limits, an interest rate floor of four per cent will be used
- For the purposes of calculating MSR limits, an interest rate floor of three per cent will be used
- The maximum Loan To Value (LTV) limit for HDB flats is reduced to 80 per cent, from the previous 85 per cent
- For those who have just disposed of a private property, there is a 15-month wait-out period before they’re allowed to purchase a resale flat. The exception is if they’re 55 years or older, and are right-sizing to a 4-room or smaller flat; in such cases, there is no wait-out period.
As the cooling measures are still so recent, we will likely see the effects only later in the coming year.
Notable trends that emerged in 2022
- Even HDB upgraders began to get priced out of new launches
- Rental is back in vogue
- Rising interest rates prompt recalculations by investors and homeowners alike
1. Even HDB upgraders began to get priced out of new launches
We’ve covered this more extensively in this previous article. Prices of $2,000+ psf have become the norm for new launches, even in non-central areas. This raises the quantum of a typical family-sized unit (around 1,000 sq. f.t) to the $2 million mark.
This marks quite a turning point, as previously it was just first-time home buyers that were priced out. Now, even those who have waited out their MOP and sold may have to opt for a more affordable resale condo instead.
Developers, on the other hand, have little leeway to drop prices. They’re caught between the uncertainty of the wider economy (e.g., the war in Europe may suddenly jack up prices of materials and fuel), and higher ABSD and Land Betterment Charges.
Couple this with a high commission in show flats, and there’s no real room left for a major discount.
2. Rental is back in vogue
2022 is the year of the landlord, with rate hikes happening across the board. This is due to the return of foreign workers, of both the S-Pass and E-Pass varieties.
However, their demand is now complemented by the large number of Singaporeans who bought homes in recent years. Those awaiting completion of their BTO or condo are adding to rental demand, as well as those who can’t buy a home but are prompted to move out (e.g., singles who are too young to buy flats, but need their own space due to arrangements like Work From Home).
Rising demand is expected to continue into 2023 (although supply will be eased with 2023 new condo completions); so it’s not surprising that more tenants are opting for longer leases. From word on the ground, more tenants are trying to “lock in” better rates with two to three-year leases. Consequently, we’ve also seen more realtors once again showing interest in rental, as it becomes a more viable business for them.
3. Rising interest rates prompt recalculations by investors and homeowners alike
Given the low-interest rates over the past decade (since around 2008/9), many Singaporean homeowners and investors are in foreign territories with loans.
It is psychologically impactful that the average bank home loan now stands at around three per cent, with fixed rate packages going as high as 4.1 per cent. The rates are no longer below the guaranteed CPF interest rate of 2.5 per cent, so the era of “borrowing for free” is well and over.
For homeowners, a particular concern is the CPF withdrawal limit – now is a good time to check if you’re close to it, as you don’t want to end up having to pay the loan in cash in your late 50s or 60s.
For investors, there is some relief among landlords – it’s possible to claim the interest portion of the mortgage as a tax deduction. Owner-investors who don’t rent out, however, are scrambling to work out the long-term impact on their returns. Property prices may be rising, but sharp hikes in interest rates will eat into any eventual returns.
We expect a lot of investors will be reviewing their decisions, in the next few months.
Overall, 2022 was a bumpy and unpredictable year, and we’ve yet to see the full effects sink in. We would be more defensive going into 2023, as it’s unclear how the effects on the property market are playing out. One thing is for sure: we’re going into 2023 at sky-high prices, which should make any buyer hesitant.
Finally, from the team at Stacked, have a good long weekend break and a Happy New Year!
For more updates and trends on the Singapore property market, follow us at Stacked. We’ll also provide in-depth reviews of new and resale properties alike, so you can make a better-informed choice.
Bagikan Berita Ini


0 Response to "2022 Year-End Review Of The Singapore Property Market: Key Numbers And Trends You Need To Know - Property ... - Stacked"
Post a Comment