Commentary
 7 min read
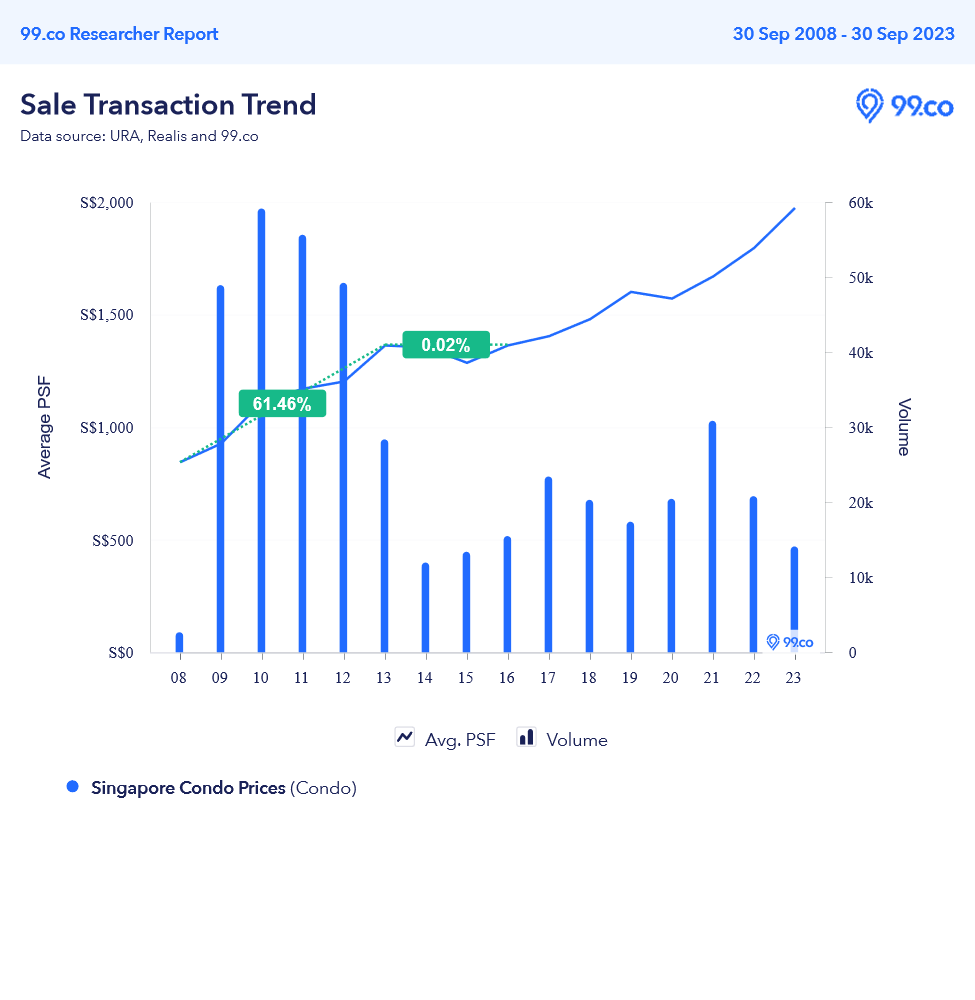
If you’ve asked for property comparisons before, you might notice two different agents can show you two different data sets. And as some readers have pointed out, they can encounter prices that are far higher than the project’s average (or if they’re lucky, far lower). There are plenty of reasons, but part of it is due to the difficulties in finding property data. While we do our best, here are some of the usual problems we run into, which have to be accounted for:
1. Timing issues can make certain properties look better, or worse
One example of this is Starlight Suites, which tends to sneak its way into lists whenever we look for large losses. But a closer look reveals that it mainly boils down to timing: Starlight Suites was launched close to a slew of cooling measures, making it look like a “bad” project in terms of resale gains (we even put out this article to specifically explain this condo’s situation).
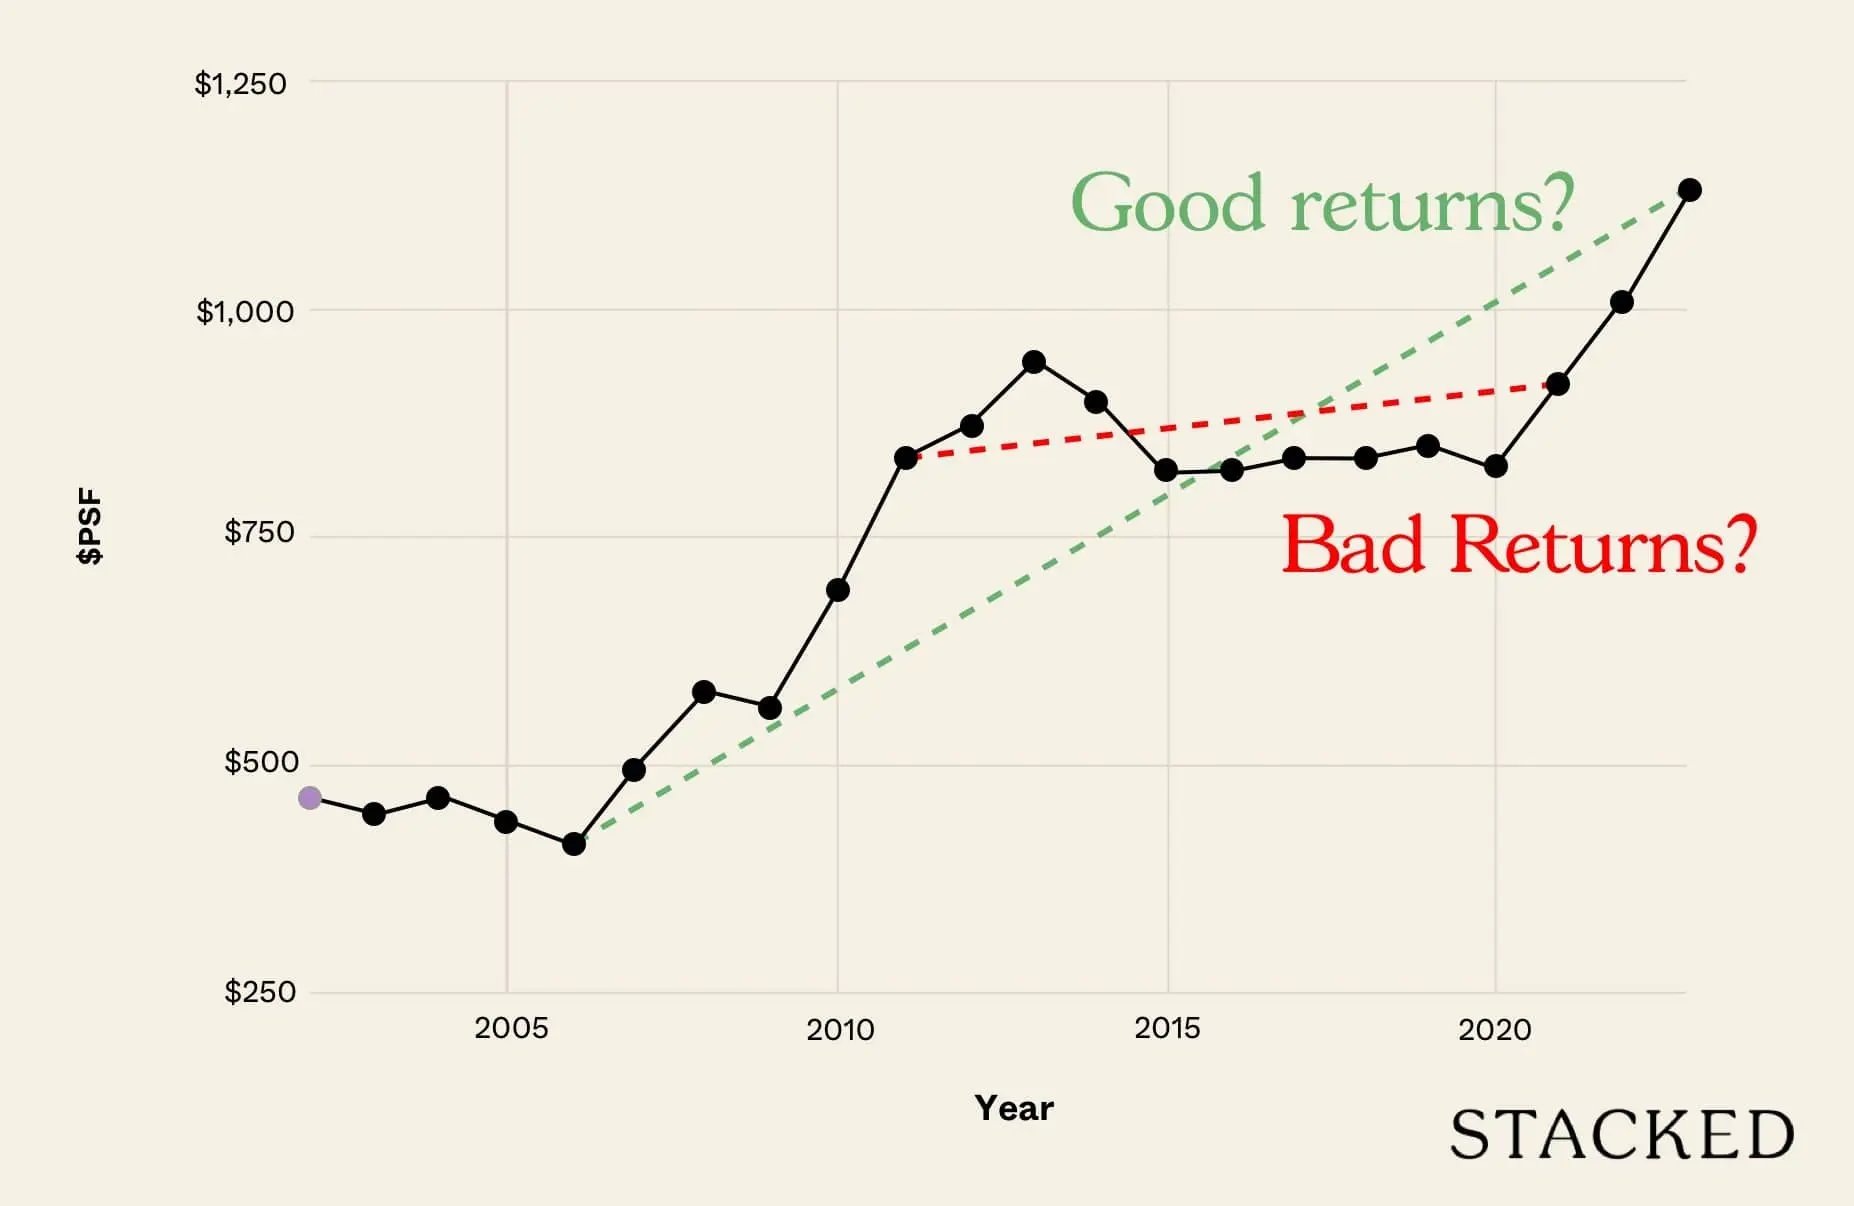
Condos bought at a peak (around 2013), tend to look disproportionately bad, compared to other condos in the same neighbourhood. Likewise, condos bought at a market trough (around 2015 to 2016), may have seen exceptional gains; even if a visit to the condo shows nothing particularly outstanding.
(Note the rapid surge in prices building up to the last peak in 2013, and the almost flat prices in years leading up to 2016).
Projects that launched during these unusual periods owe their performance to market circumstances, and not so much layout, architecture, location, etc. So when you do compare the performance of different condos, perhaps it’s good to look at the dates of the given transactions, before jumping to a conclusion.
2. Low transaction volumes can make price history useless
When it comes to boutique projects, price history becomes unhelpful. There are so few units, and transactions are so rare, that it’s difficult to draw conclusions. Quite often, the very last transaction will “set the tone” for the entire project.
Here’s what we mean: The Sanctuary @ Geylang has only 21 units. If we were to look at gains, this is a well-performing condo with 11 profitable transactions and no losses. But this is what the price history looks like on Square Foot Research:
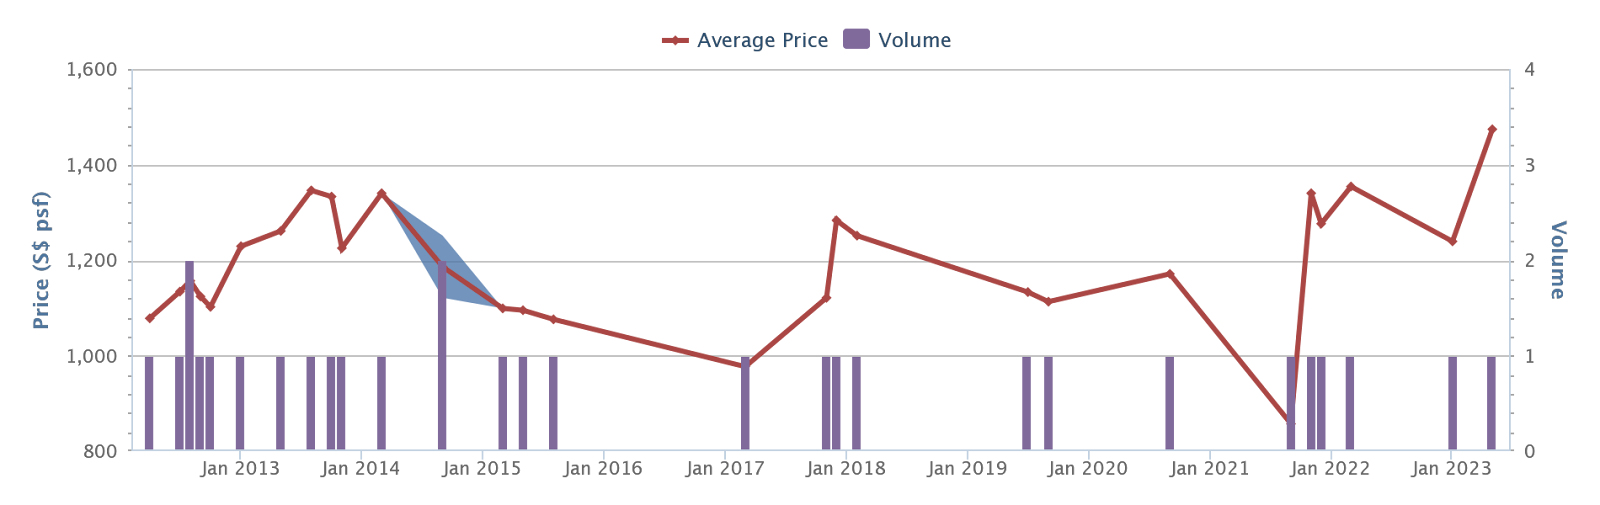
It’s mainly a series of single transactions, with long periods of no activity. One particularly enthusiastic buyer, an urgent sale, or perhaps even a sale to a family member at a discount, could cause the visible price average to take a big swing up or down.
This volatility can exaggerate how profitable, or unprofitable, a boutique condo looks on paper. In fact, one of the risks faced when buying boutique condos is that, if the transaction before yours was unusually low, you might end up seeing poor gains (as the buyers will base their offer on said transaction).
This also applies when looking at wider issues
There are, for example, a very small number of HDB Maisonettes compared to other flat types; and there are neighbourhoods where transactions are much less frequent (flats in Marine Parade are notorious for these, as units there don’t change hands as often as many other neighbourhoods).
In these scenarios, price history and associated data can also paint a distorted picture. So when looking at price movements, do take into account transaction volumes as well. On Stacked we’ll usually warn you if our data is based on a low number of transactions.
3. Outliers that need to be accounted for
Many property sites these days, such as property portals, come with extensive transaction data and even built-in graphing tools. But while these are good at showing you a snapshot, or a guide to the overall trends, they don’t usually take into account outliers.
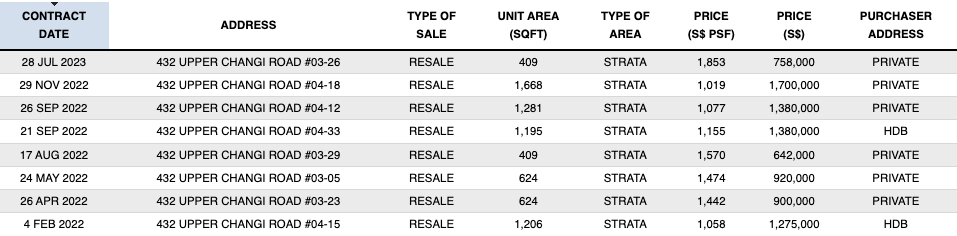
One recent example is East Village, where the average psf for the development over the last 6 months is shown to be $1,853. However, a deeper look into the data would show that this was the only transaction in 2023 – and it was for the smallest 409 sq. ft. unit. This is also a record-high psf for the project, as the past few transactions before that averaged $1,256 psf in 2022.
In theory, these outliers should be infrequent and shouldn’t affect the overall results too much. But if you do want accuracy, the correct thing to do would be to exclude these.
*That said, sometimes outliers in the data can contribute to a price appreciation for the project. In an upmarket, future transactions may be based on that sole transaction, so it’s not always so black and white.
4. Prior to 2020, new sale data was distorted by OTP extensions and re-issues
For more details on this, see our article on restrictions passed in September 2020, regarding the re-issue or extension of the Option To Purchase (OTP).
Prior to the rule change, developers had a lot of leeway to extend the OTP, which is usually for a period of just 21 days. One common tactic was to promise to re-issue the OTP whenever the old one lapsed; this would allow buyers more than 21 days to secure the needed financing.
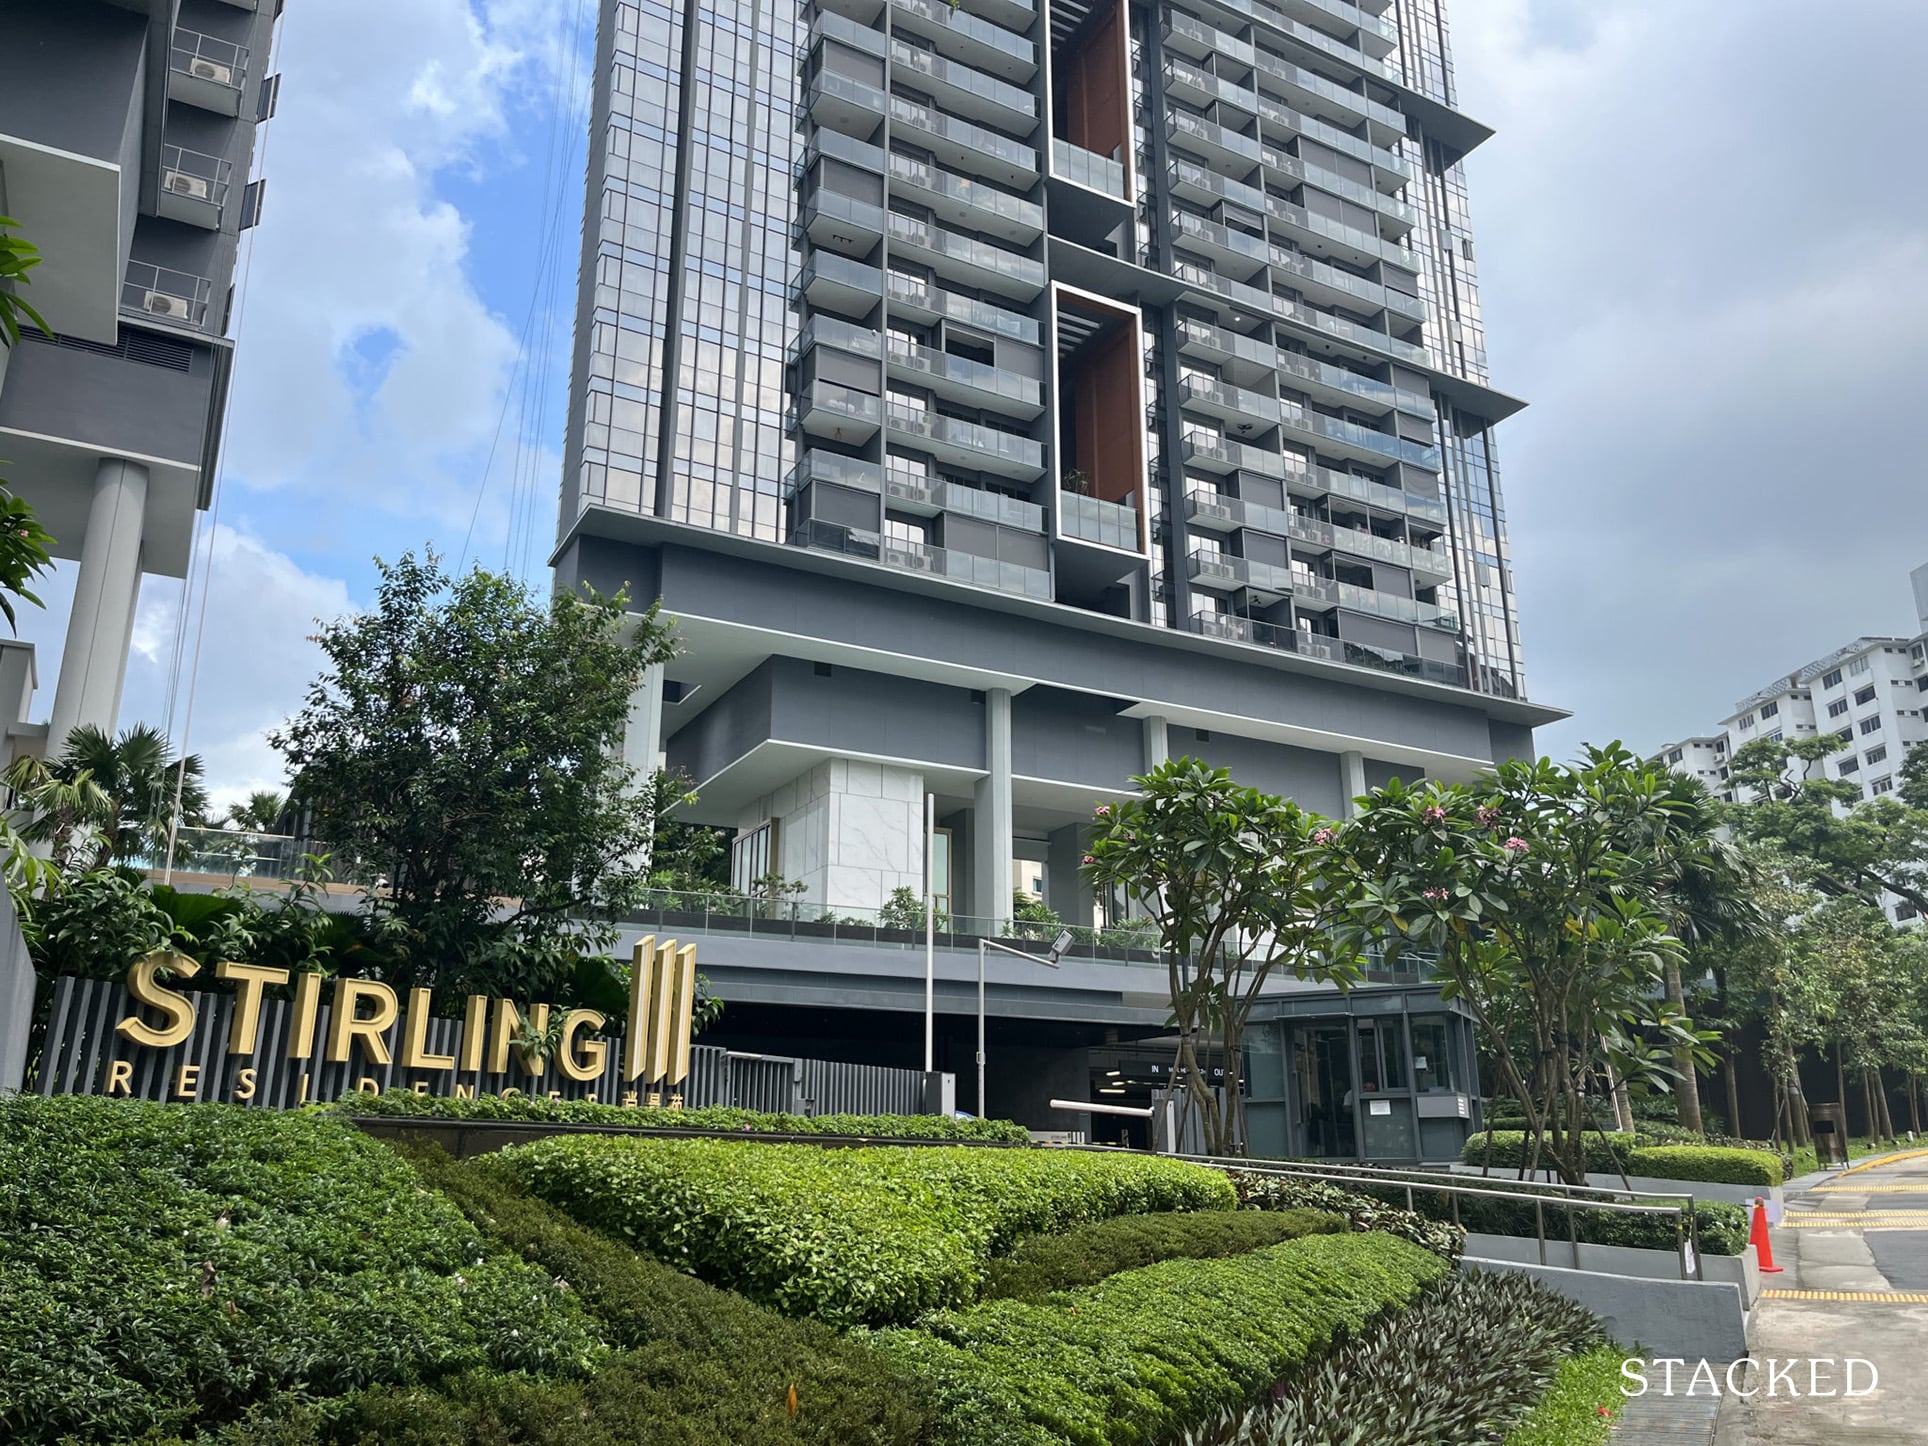
However, there was seldom any accounting for units that were returned (we recall local property blogs calling it out with URA data, like this one showing that Stirling Residences saw 43 of 89 “sold” units being returned).
This could cause present distortions, as someone who allegedly “bought” the unit at the developer price, but later returned the unit, may not have had that transaction erased. This is not a big problem going forward, as it’s since been corrected – but it could matter in situations where past data becomes relevant.
5. The “averages” of a project can be misleading, because some projects have significantly different stacks and units
A typical example of this is Home School Distance (HSD). As we’ve covered in a previous article, some condos have stacks that are within one kilometre, and others that are not. This means only some of the units are within enrolment distance, and this could cause a price disparity between units that are a block apart.
Likewise, there are always premium stacks in a project with better facing, or which have features the others don’t (e.g., private lifts). For this reason, averaging out the price psf is practical, but not always accurate.

This is even more apparent in mega-developments like D’Leedon or Interlace, where some stacks may have more units than an entire development.
Units with special features may also defy the overall trend in the project. Units facing landed or green spaces, for instance, may perform much better than the average of the entire project. This means that for bigger projects you would have to delve deeper into the stacks, rather than look at the development as a whole.
6. Price psf is not always a good indicator
When making comparisons, price psf is useful only if there are significant similarities between the units (e.g., comparing between all units with the same layout, or within the same block). However, we’ve run into buyers presented with marketing materials that ignore this. For example:
A unit in condos like The M can cost around $3,000+ psf. Someone may show you proof, and then try to convince you that – because data shows price averages of $2,700+ psf in the area, you should therefore pick a cheaper option (probably the one they’re trying to sell you).
This overlooks the fact that it’s one-bedders in The M which can reach $3,000+ psf, and that the actual quantum of such a unit could be $1 million or below. Smaller units tend to have a higher price psf, whereas larger units tend to have a lower price psf. So it’s not very helpful, for instance, to compare the price psf of a three-bedder unit to an area dominated by shoebox units.
At the very least, unit sizes should be taken into account; otherwise, you could get a distorted picture of what’s cheap or pricey.
Likewise, this is a similar issue when you were to compare between older resale condos and a new launch. While a new launch may have a higher psf, the overall quantum may still be lower due to the smaller and typically more efficient space.
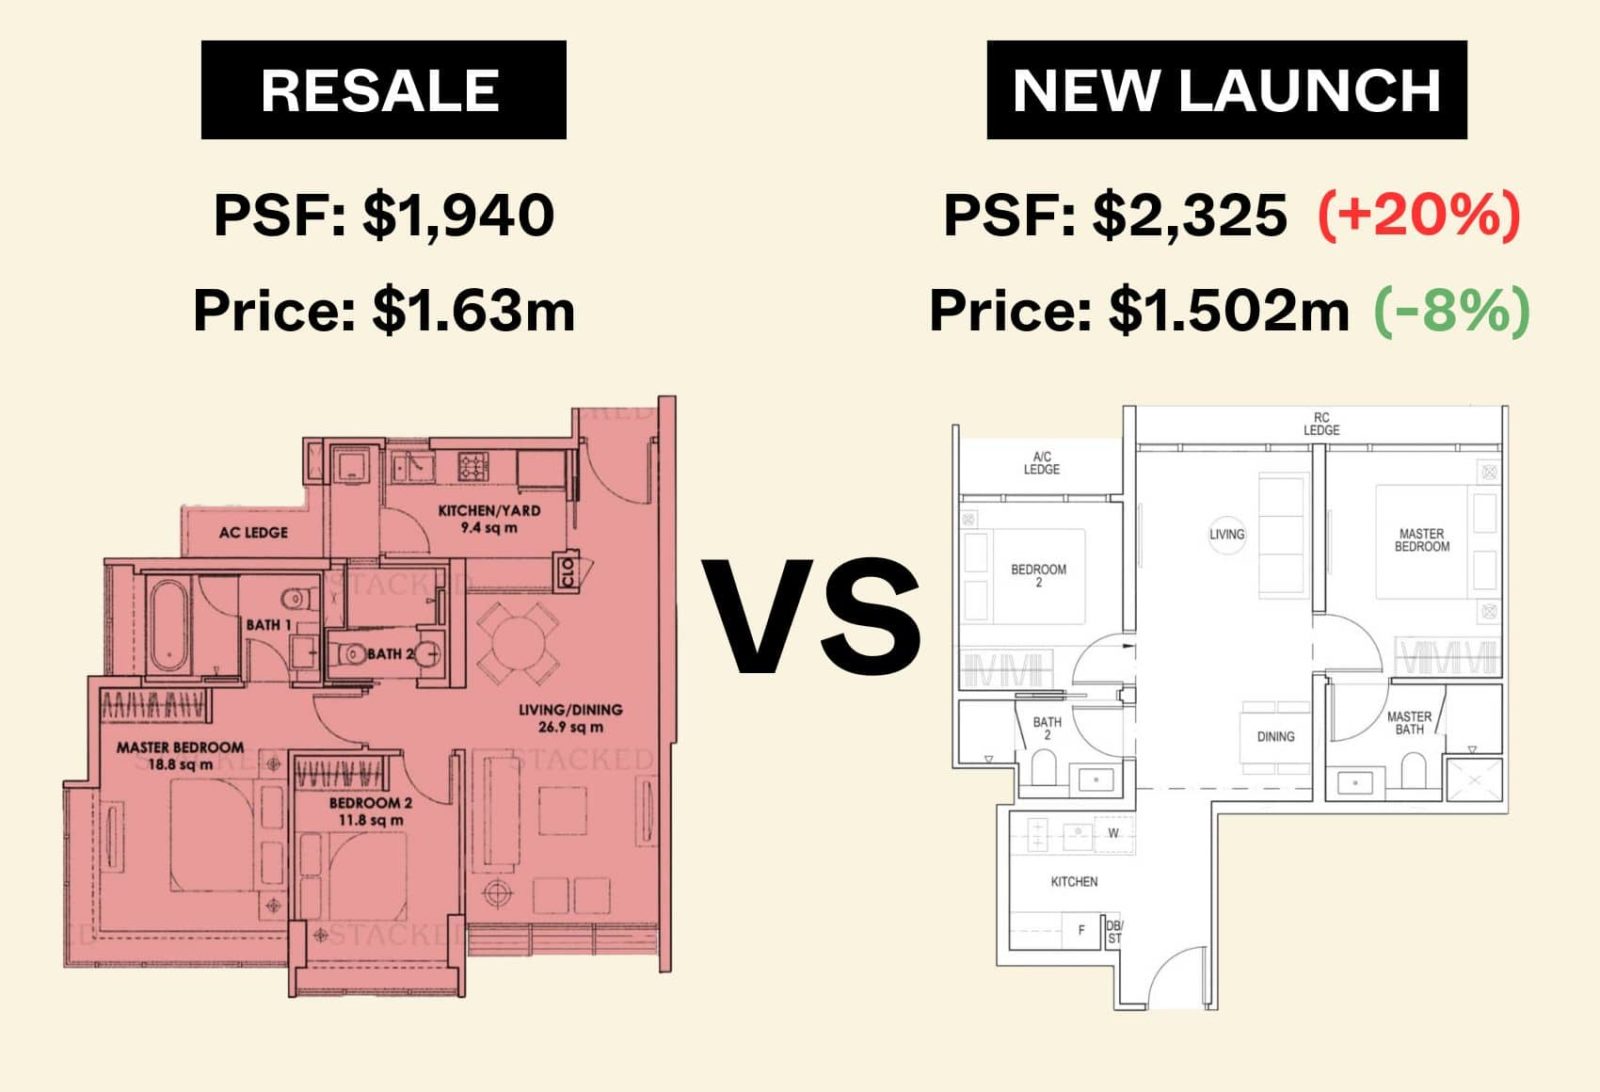
An added issue here is void space (the space between the floor and ceiling), which is factored into the square footage. In older records, this distorted the price psf to look lower. For example, consider a 1,200 sq. ft. unit for $1.5 million, in which 200 sq. ft. is void space.
This comes to $1,250 psf, which may look cheaper than nearby options – but it’s not accounting for the fact that 200 sq. ft. is unusable “air space.” If you factor in only the usable space (1,000 sq. ft.), the price is more properly $1,500 psf.
Strata void spaces are no longer counted this way, as of April this year. However, the past records of many projects haven’t been updated to account for this very new change; so we’d still keep an eye out if you’re buying a resale unit.
Have you come across any data distortions in the property market? Comment below and let us know. In the meantime, follow us on Stacked for insights into new and resale properties alike.
Bagikan Berita Ini


0 Response to "6 Common Ways Property Data Can Be Misleading: Here's How Not To Be Fooled - Stacked"
Post a Comment