Which Cities Have Bubble Risk in Their Property Markets?
Buoyed by low interest rates for the last decade, many property markets have seen substantial price growth since 2010. Experts warned that real estate bubbles—in which the price of assets moved up far beyond their intrinsic value—were forming.
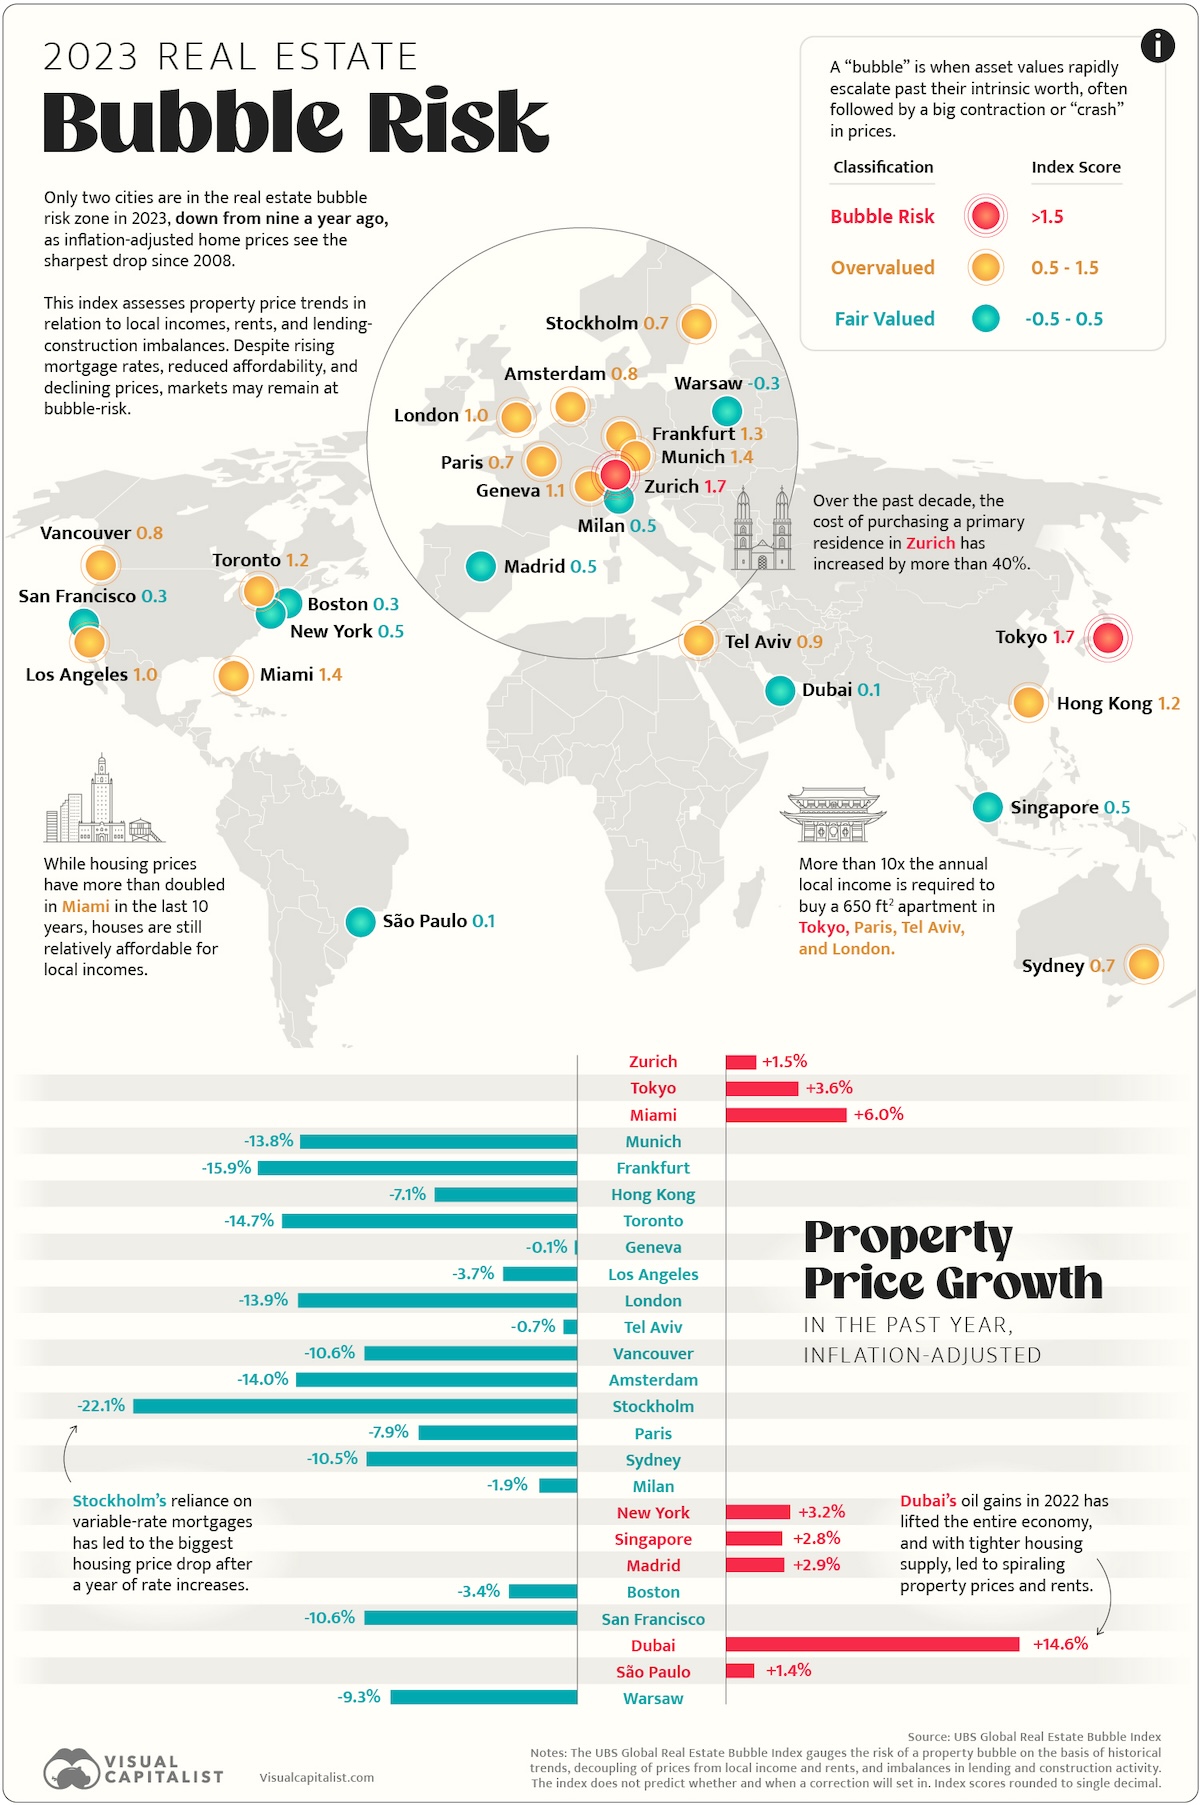
The UBS Global Real Estate Bubble Index analyzes the real estate market of 25 major cities across the globe and assigns them a score between -0.5 to 2.0 to convey bubble risk. The higher the score, the more imbalanced the market is, with those above 1.5 in “bubble-risk” territory.
We visualize the data in the above map, along with charting the real property price changes in the last year.
Ranking Bubble Risk by City
At the top of UBS’ findings is Switzerland’s financial capital Zurich, with a 1.71 score, putting the city firmly in the bubble-risk zone. With its high-income earners and the country’s low interest rates, the city has been steadily climbing the real estate bubble-risk rankings, 5th in 2021, to 3rd in 2022, to the top spot this year.
Unlike many of its former peers in the risky territory, local prices adapted to increased mortgage rates this year, and have stayed elevated.
Here’s the full rankings for bubble risk in all 25 property markets:
| Rank | City | Index Score | Rating |
|---|---|---|---|
| 1 | 🇨🇭 Zurich | 1.71 | Bubble-Risk |
| 2 | 🇯🇵 Tokyo | 1.65 | Bubble-Risk |
| 3 | 🇺🇸 Miami | 1.38 | Overvalued |
| 4 | 🇩🇪 Munich | 1.35 | Overvalued |
| 5 | 🇩🇪 Frankfurt | 1.27 | Overvalued |
| 6 | 🇭🇰 Hong Kong | 1.24 | Overvalued |
| 7 | 🇨🇦 Toronto | 1.21 | Overvalued |
| 8 | 🇨🇭 Geneva | 1.13 | Overvalued |
| 9 | 🇺🇸 Los Angeles | 1.03 | Overvalued |
| 10 | 🇬🇧 London | 0.98 | Overvalued |
| 11 | 🇮🇱 Tel Aviv | 0.93 | Overvalued |
| 12 | 🇨🇦 Vancouver | 0.81 | Overvalued |
| 13 | 🇳🇱 Amsterdam | 0.80 | Overvalued |
| 14 | 🇸🇪 Stockholm | 0.74 | Overvalued |
| 15 | 🇫🇷 Paris | 0.73 | Overvalued |
| 16 | 🇦🇺 Sydney | 0.67 | Overvalued |
| 17 | 🇮🇹 Milan | 0.49 | Fair-Valued |
| 18 | 🇺🇸 New York | 0.47 | Fair-Valued |
| 19 | 🇸🇬 Singapore | 0.47 | Fair-Valued |
| 20 | 🇪🇸 Madrid | 0.46 | Fair-Valued |
| 21 | 🇺🇸 Boston | 0.34 | Fair-Valued |
| 22 | 🇺🇸 San Francisco | 0.27 | Fair-Valued |
| 23 | 🇦🇪 Dubai | 0.14 | Fair-Valued |
| 24 | 🇧🇷 São Paulo | 0.09 | Fair-Valued |
| 25 | 🇵🇱 Warsaw | -0.28 | Fair-Valued |
Tokyo (1.65) is the second and final entry in the real estate markets with immediate bubble risk. This is a decrease from nine total cities in that category last year.
In fact the other seven real estate markets which scored above 1.5 in 2022 have all seen significant real property price drops, many of them in the double-digits, which has moved them into “overvalued territory.”
These include: Frankfurt (-15.9%), Toronto (-14.7%), Amsterdam (-14.0%), Munich (-13.8%), Vancouver (-10.6%), Hong Kong (-7.1%), and Tel Aviv (-0.7%).
The key driver of these price drops across the board are the aggressive interest rate hikes to counter rising inflation, which pushed many housing markets into unaffordability, forcing sellers to lower their prices.
However, a few cities have seen real property price increases, including the aforementioned Tokyo and Zurich.
Here’s UBS’ full ranking of real property price changes between 2022–2023.
| Rank | City | Real Property Price Growth (YoY) |
|---|---|---|
| 1 | 🇦🇪 Dubai | +14.6% |
| 2 | 🇺🇸 Miami | +6.0% |
| 3 | 🇯🇵 Tokyo | +3.6% |
| 4 | 🇺🇸 New York | +3.2% |
| 5 | 🇪🇸 Madrid | +2.9% |
| 6 | 🇸🇬 Singapore | +2.8% |
| 7 | 🇨🇭 Zurich | +1.5% |
| 8 | 🇧🇷 São Paulo | +1.4% |
| 9 | 🇨🇭 Geneva | -0.1% |
| 10 | 🇮🇱 Tel Aviv | -0.7% |
| 11 | 🇮🇹 Milan | -1.9% |
| 12 | 🇺🇸 Boston | -3.4% |
| 13 | 🇺🇸 Los Angeles | -3.7% |
| 14 | 🇭🇰 Hong Kong | -7.1% |
| 15 | 🇫🇷 Paris | -7.9% |
| 16 | 🇵🇱 Warsaw | -9.3% |
| 17 | 🇦🇺 Sydney | -10.5% |
| 18 | 🇨🇦 Vancouver | -10.6% |
| 19 | 🇺🇸 San Francisco | -10.6% |
| 20 | 🇩🇪 Munich | -13.8% |
| 21 | 🇬🇧 London | -13.9% |
| 22 | 🇳🇱 Amsterdam | -14.0% |
| 23 | 🇨🇦 Toronto | -14.7% |
| 24 | 🇩🇪 Frankfurt | -15.9% |
| 25 | 🇸🇪 Stockholm | -22.1% |
A significant outlier within this group, Dubai, has registered double-digit growth property price growth. This was fueled by expanding household incomes—thanks to an economic boom from oil prices—as well as increased immigration by wealthy individuals.
Ranked: Cities With Rising Rental Prices
However, even as property prices have cooled in the majority of the analyzed real estate market, the rental market for many cities, like Vancouver (+10.7%) and Toronto (+6.0%) has moved swiftly in the opposite direction.
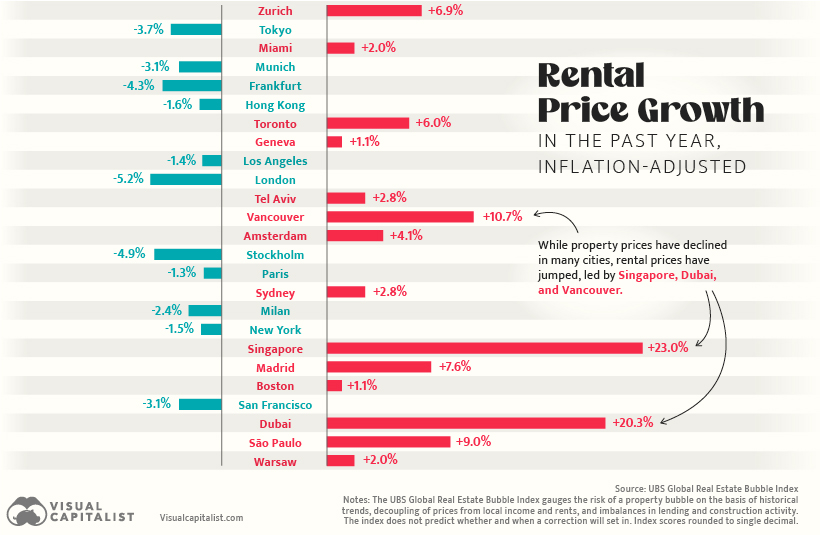
In this case, inflation is a key reason as well—pushing up incomes, in turn leading to rising rents. Furthermore, owners-occupants with tenants seek to pass on higher mortgage costs in an effort to reduce their financial burden.
Where Does This Data Come From?
Source: UBS Global Real Estate Index (2023).
Note: The term “bubble” refers to a substantial and sustained mispricing of an asset, the existence of which cannot be proved unless it bursts. But historical data reveals patterns of property market excesses. Typical signs include a decoupling of prices from local incomes and rents, and imbalances in the real economy, such as excessive lending and construction activity. The UBS Global Real Estate Bubble Index gauges the risk of a property bubble on the basis of such patterns. The index does not predict whether and when a correction will set in. A change in macroeconomic momentum, a shift in investor sentiment or a major supply increase could trigger a decline in house prices.
Bagikan Berita Ini


0 Response to "Mapped: Which Cities Have Bubble Risk in Their Property Markets? - Visual Capitalist"
Post a Comment